Pricing|
Attribuly SaaS Pricing Design
100/100
Hand-picked 77 pricing sections, scored across conversion best practices. See what the best do differently.
Showing 1–21 of 77 examples
Every pricing section is scored across 8 conversion best practices. Copy the best practice stack, not the layout. See what converts and why.
Hand-picked from 350+ companies and analyzed by our AI conversion agent. Not a random dump of pricing tables. Every entry earns its spot.
Found a pricing table you admire? Run yours through the same scoring engine. See where you stand on the same best practices, and what to fix first.
We scored 77 pricing sections across conversion best practices. The table below shows how widely each element is adopted. The lower the number, the bigger your edge by adding it.
Hover or click to expand a feature description inside the comparison table
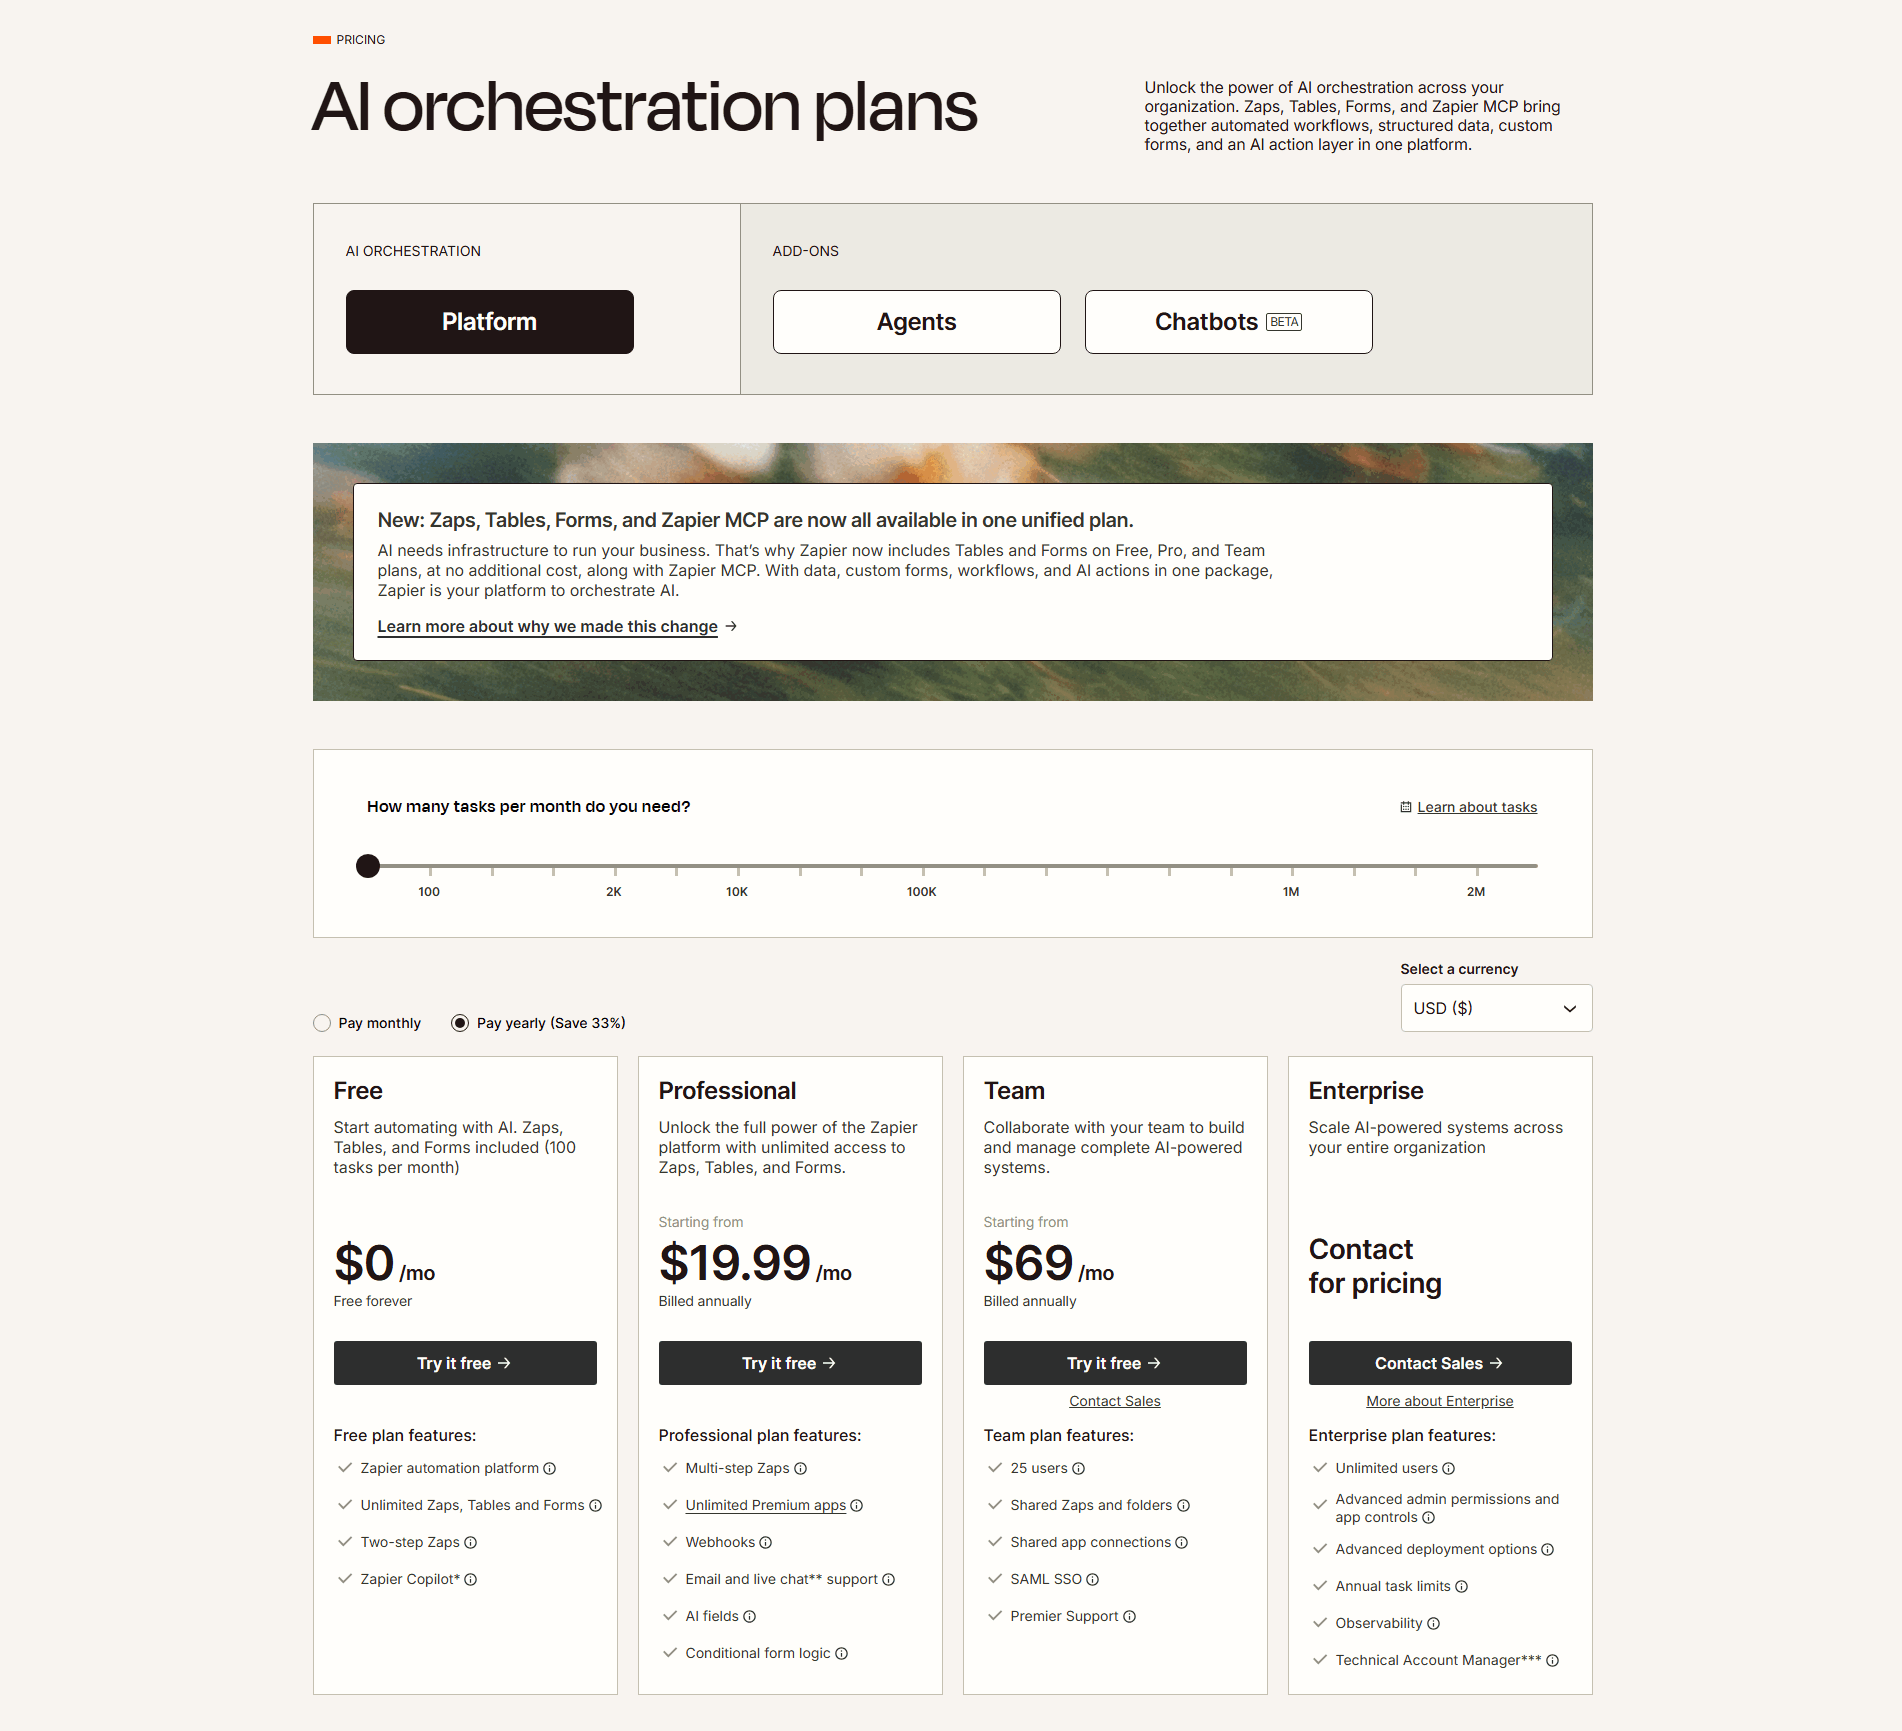
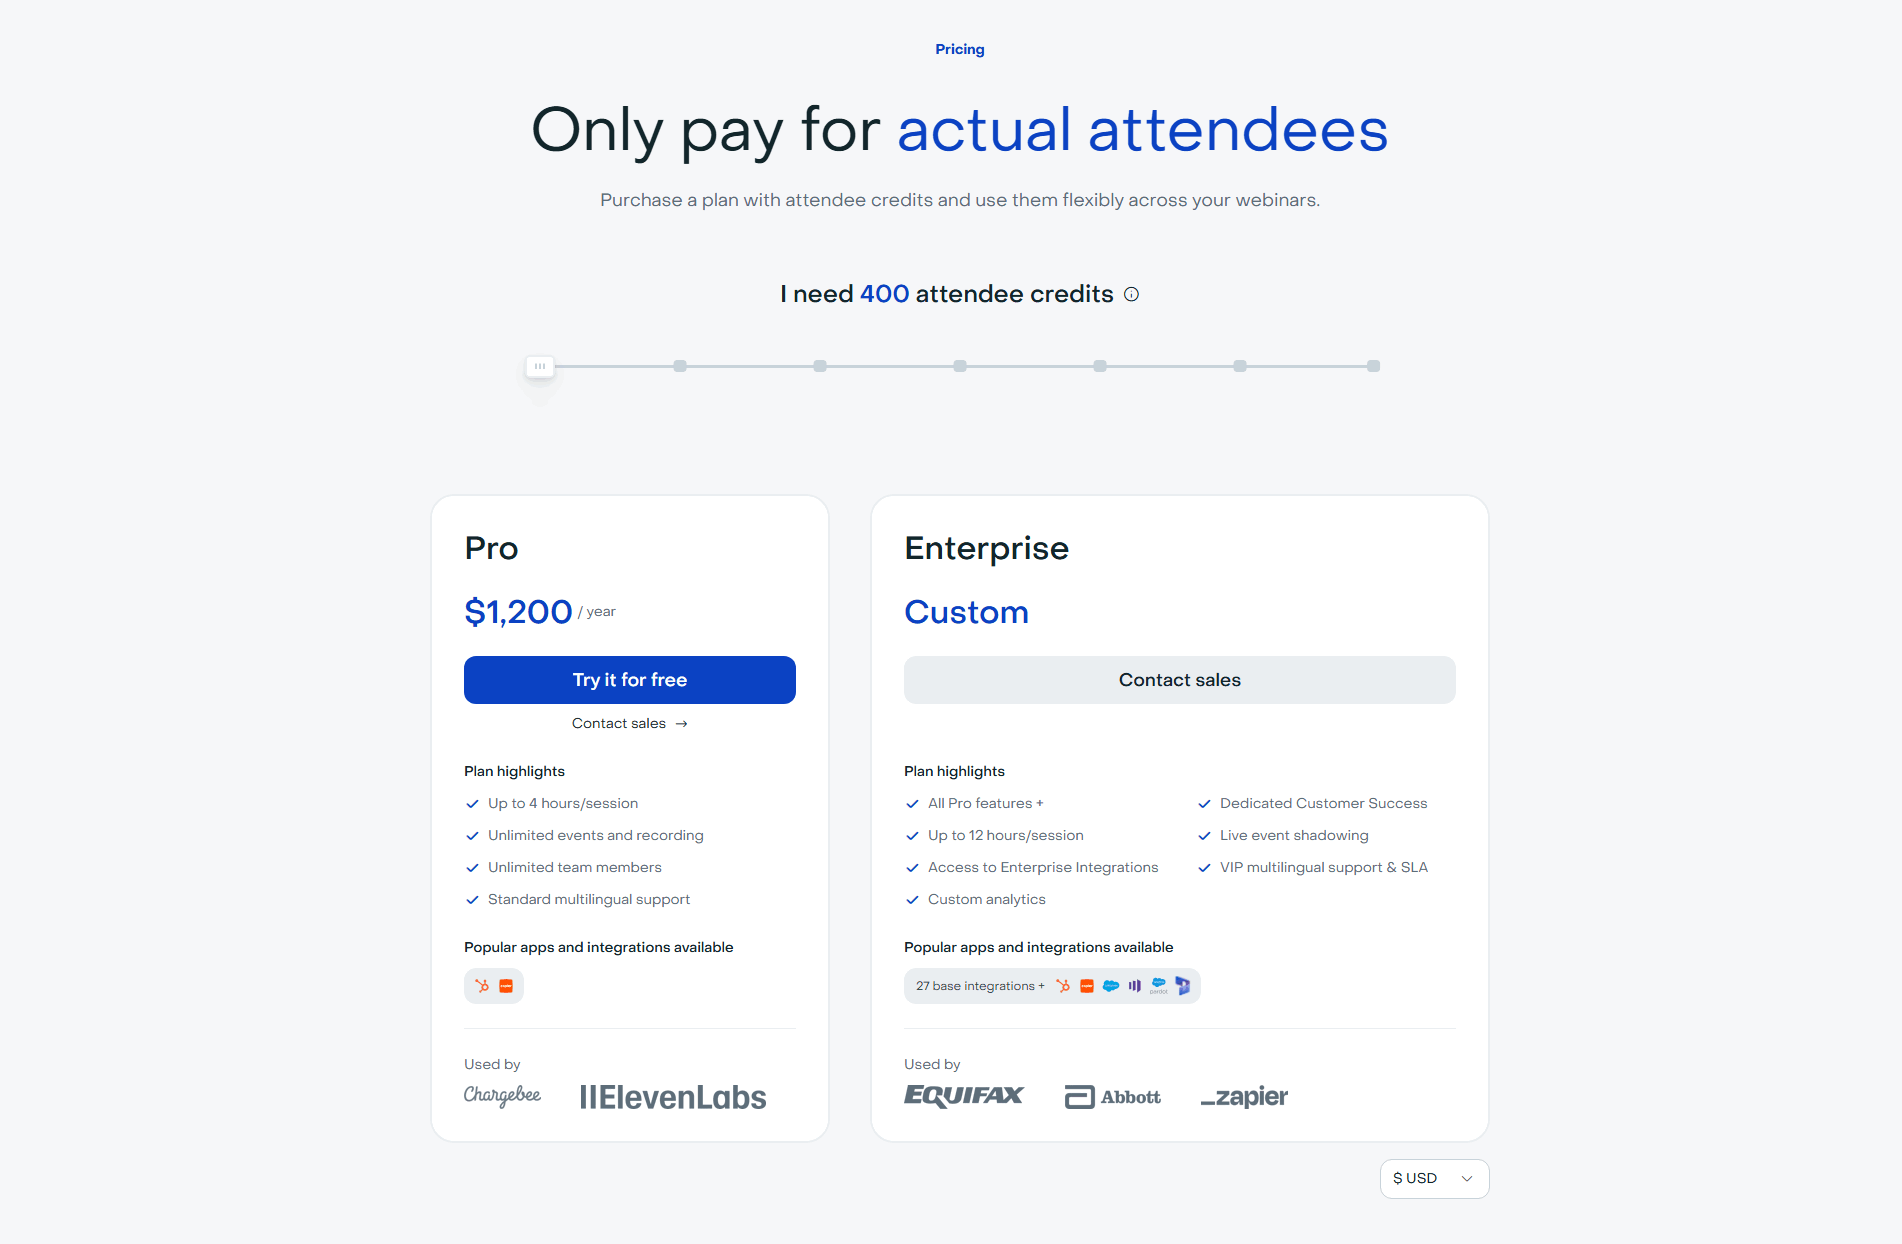
For usage-based or complex pricing: a slider or input that estimates total cost
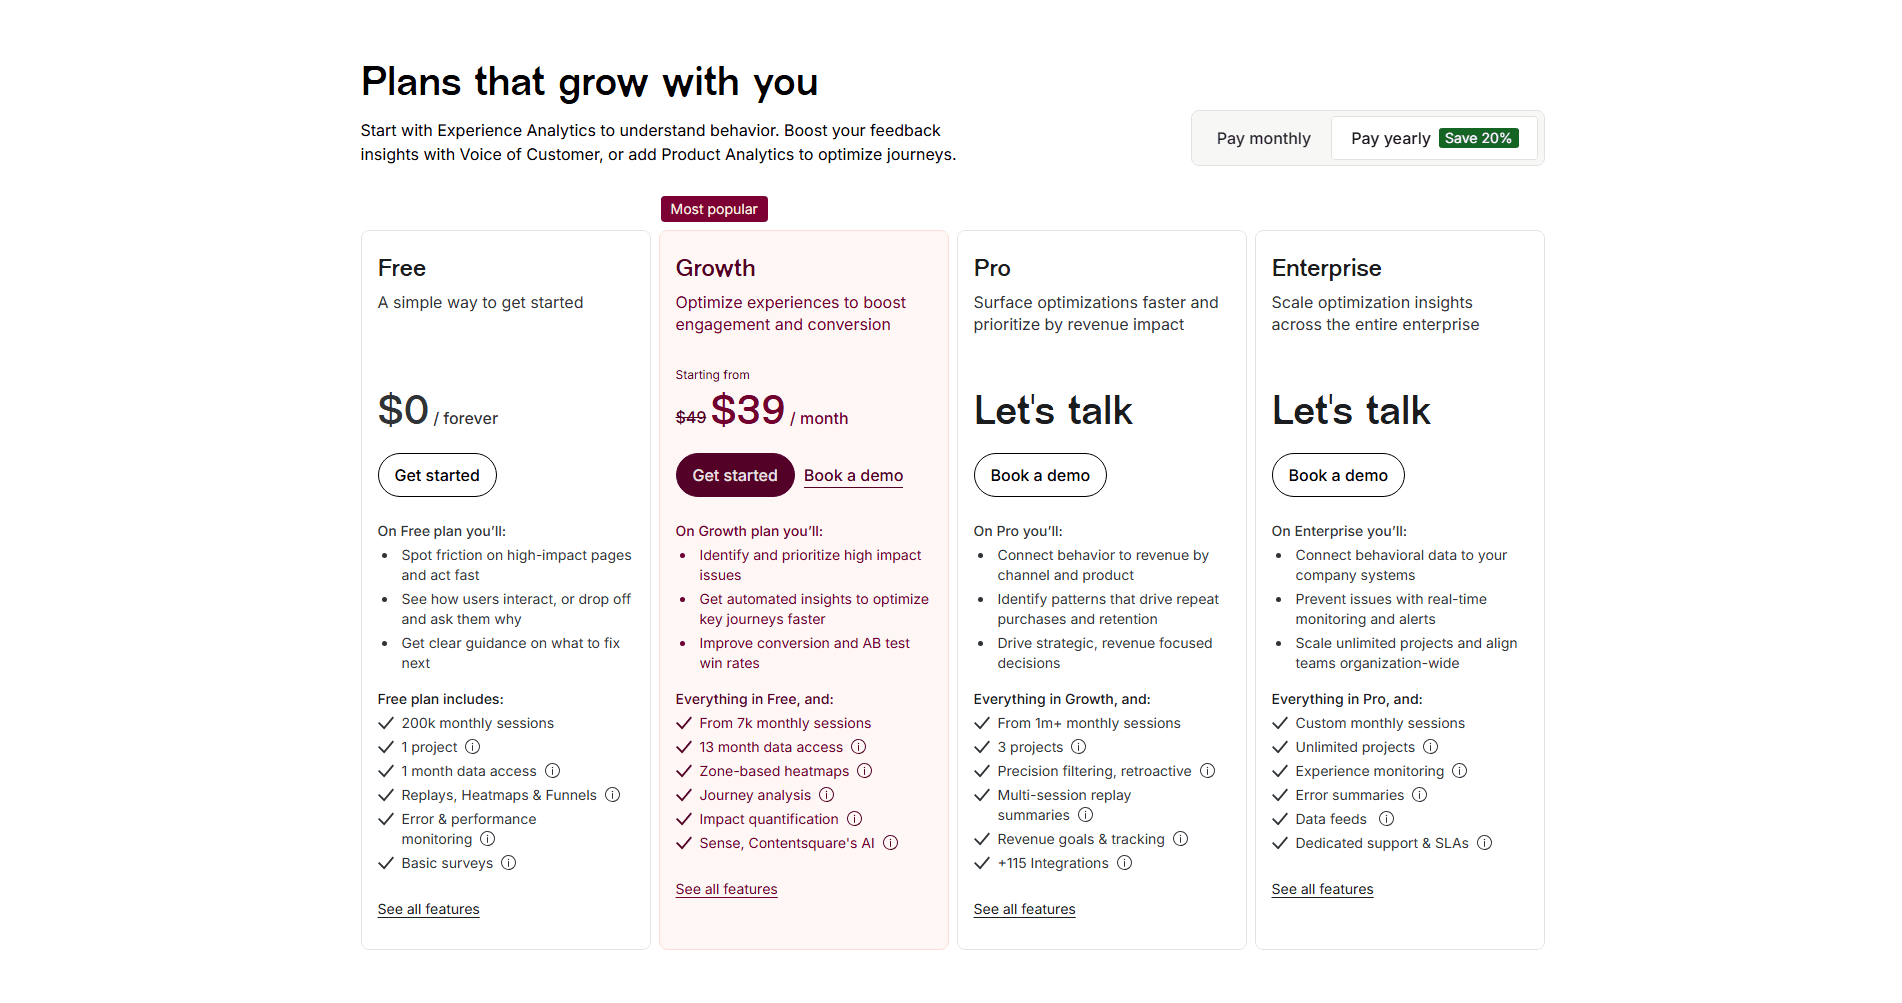
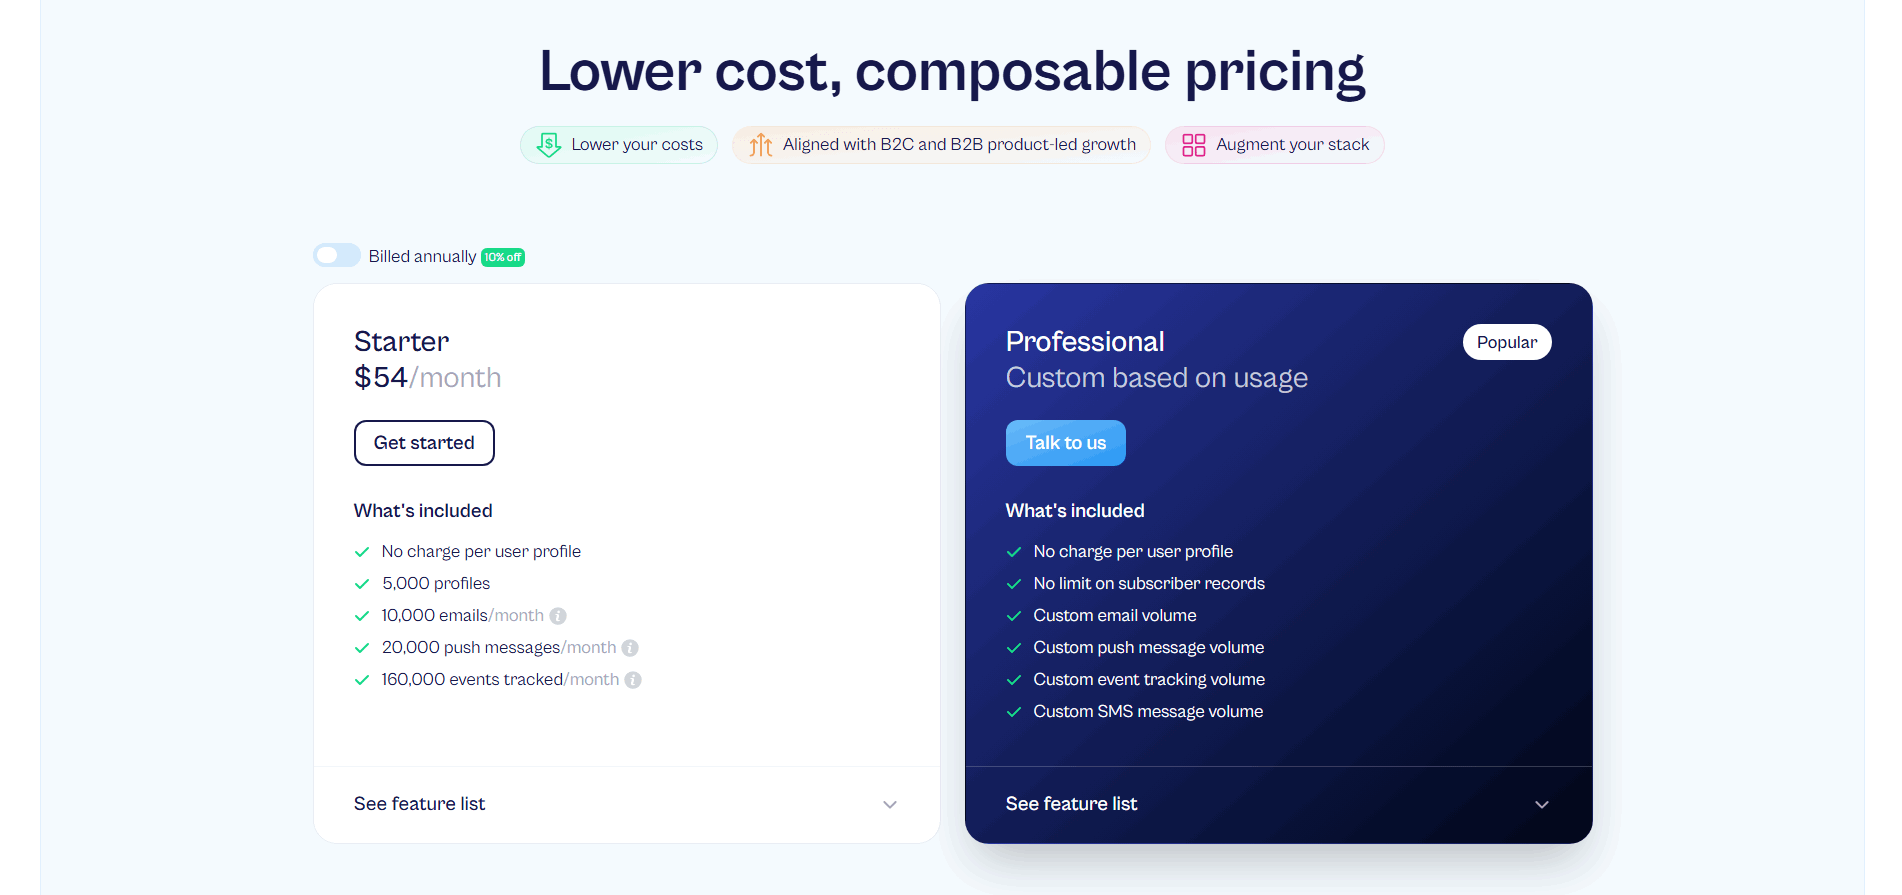
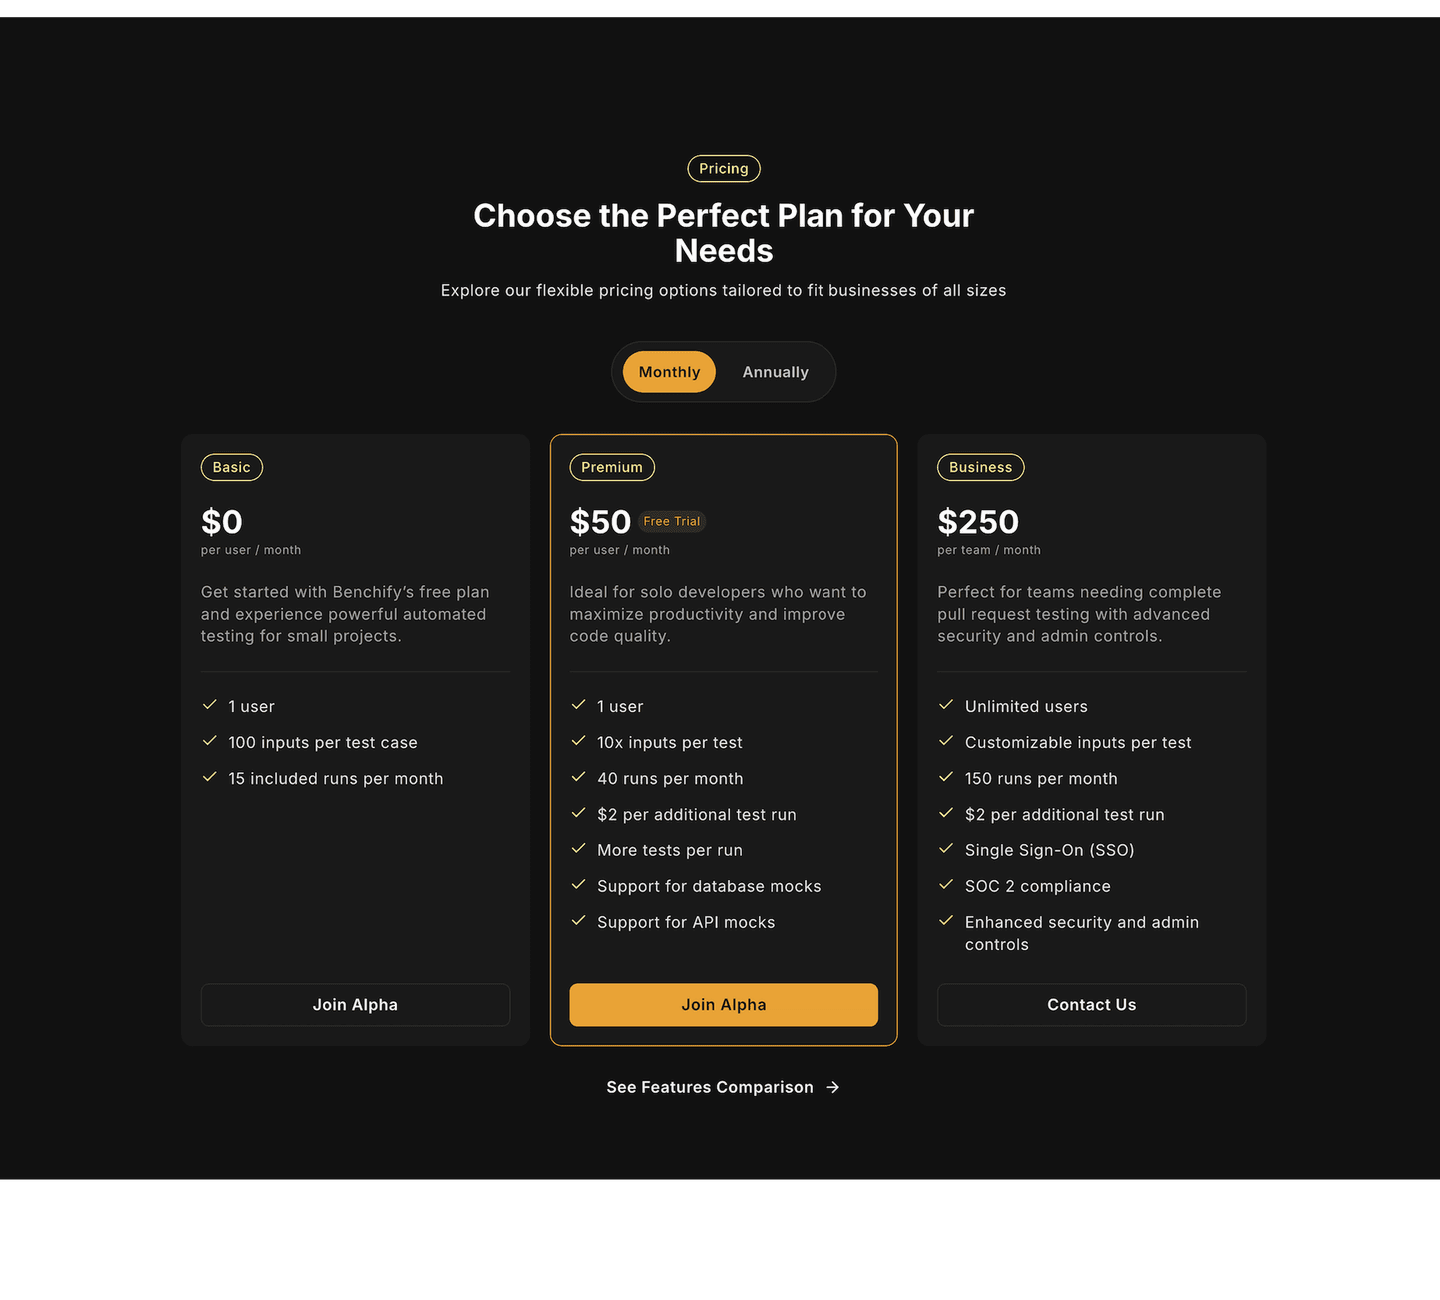
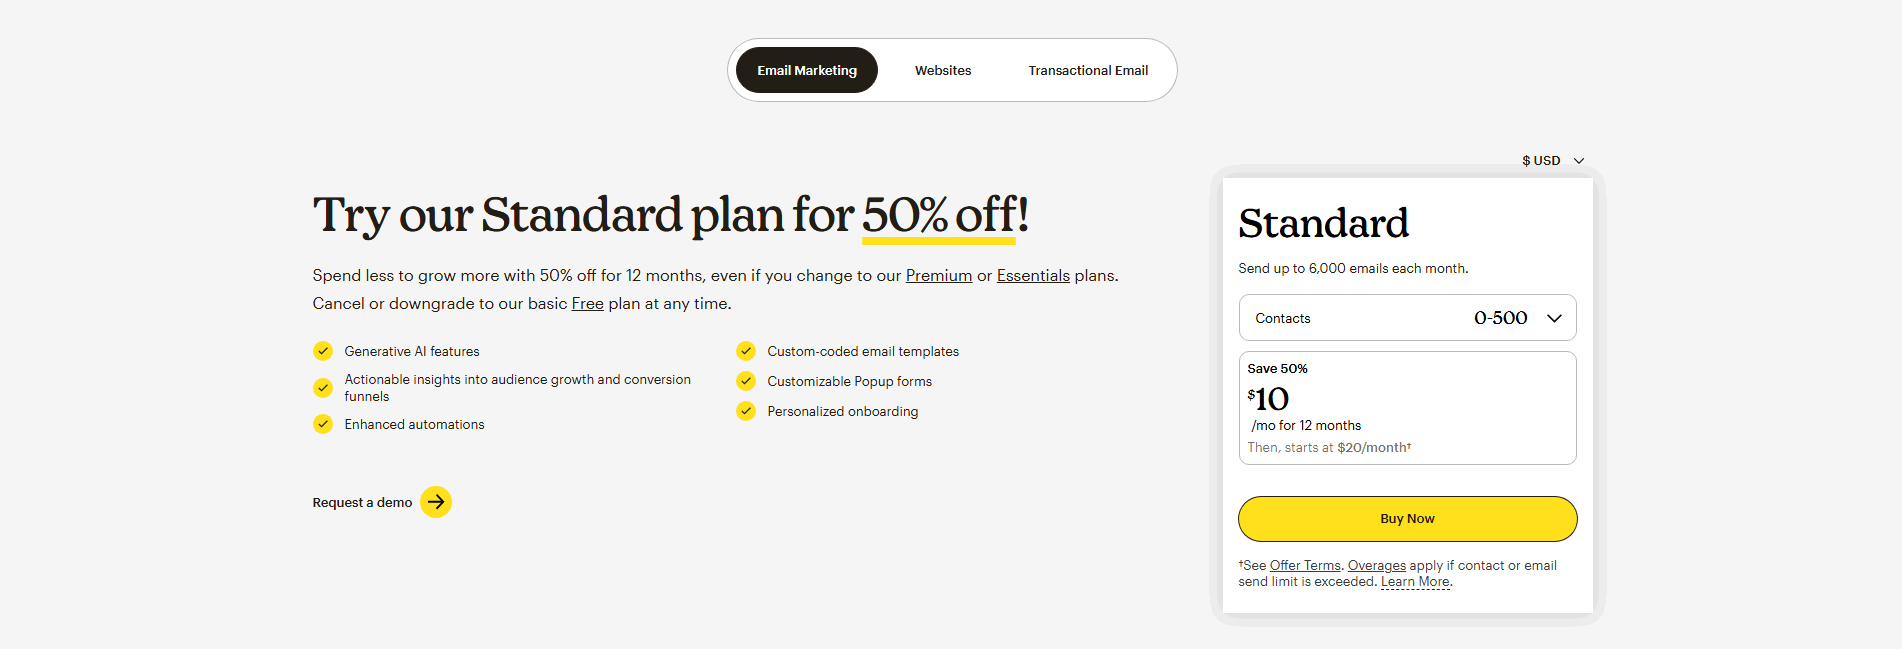
A switch showing monthly vs annual pricing with the savings displayed
"Growth" not "Tier 2," "Pro" not "Plan B." Names that map to an aspiration, not an internal SKU
"14-day free trial," "Cancel anytime," "Money-back guarantee" near the CTA button
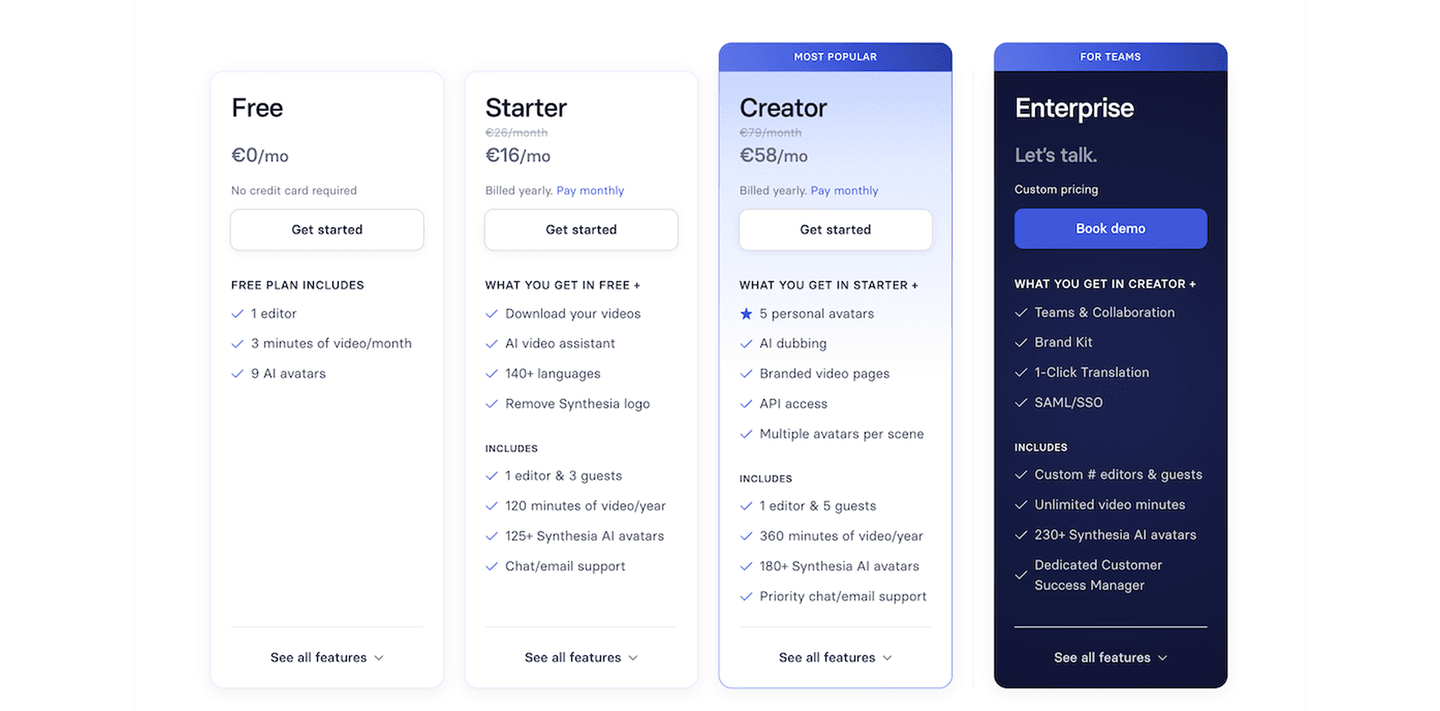
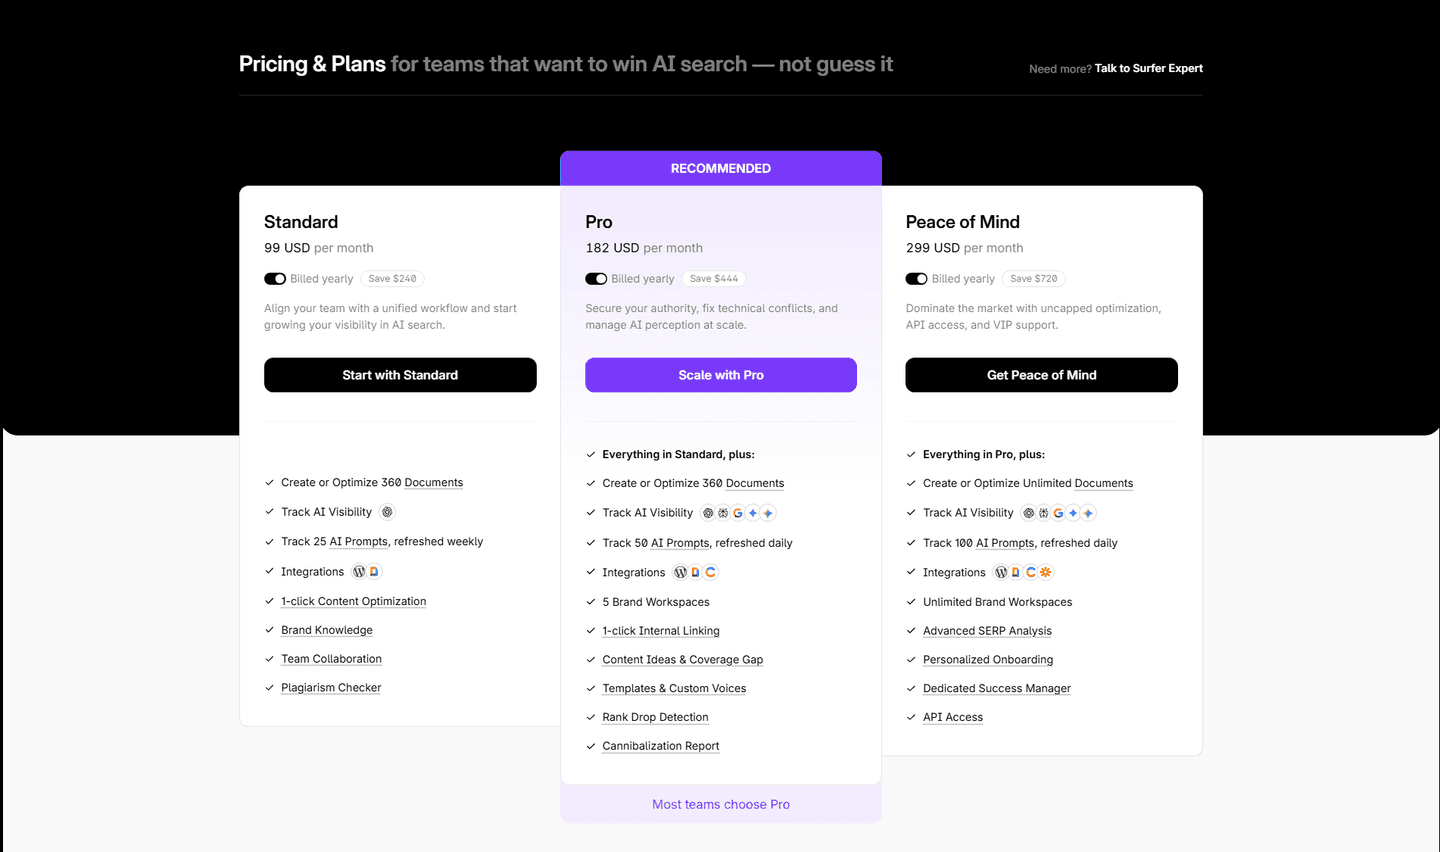
"Most Popular," "Best Value," "Recommended." A visual nudge toward the plan you want them to pick
Side-by-side columns with a feature matrix. The visitor can scan horizontally without scrolling or opening tabs
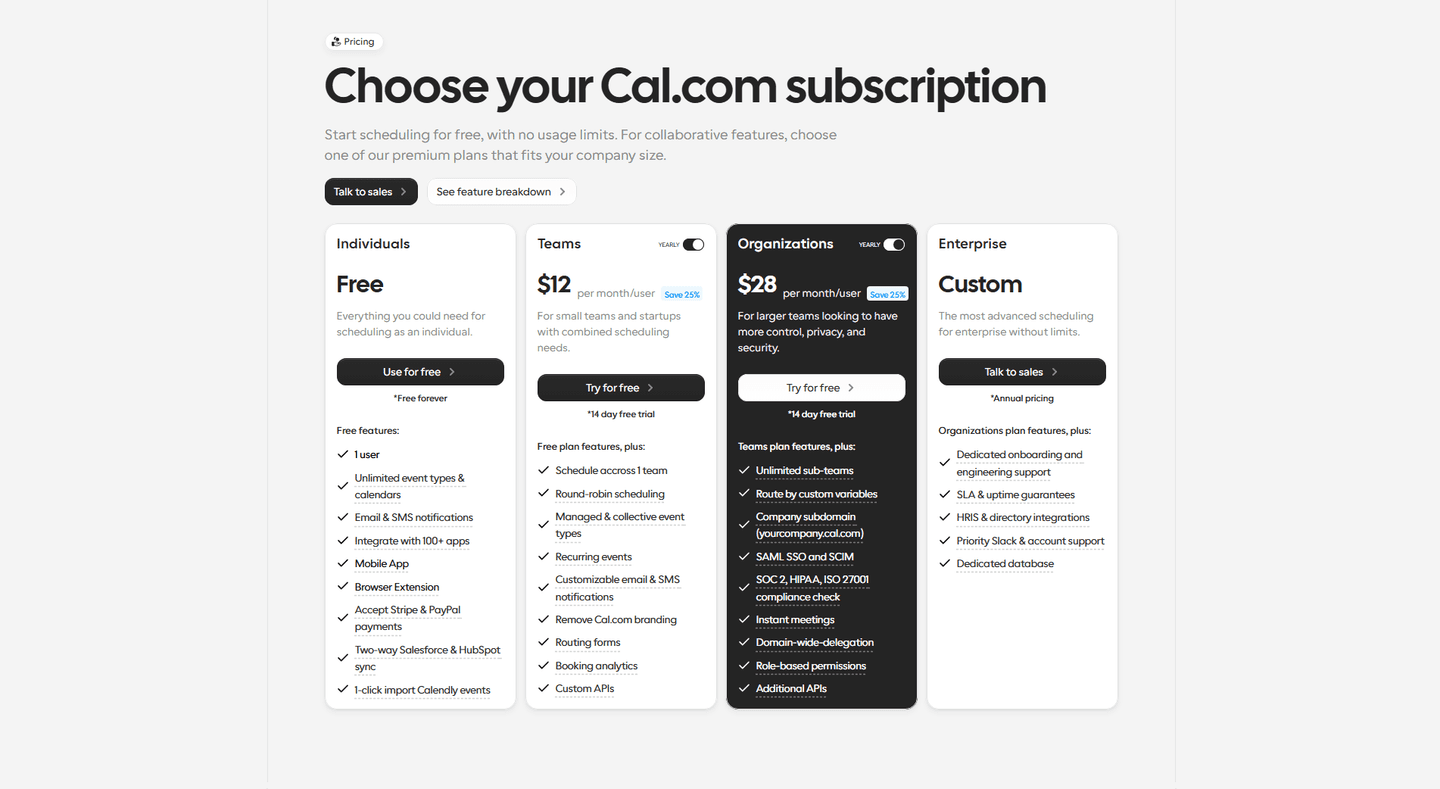
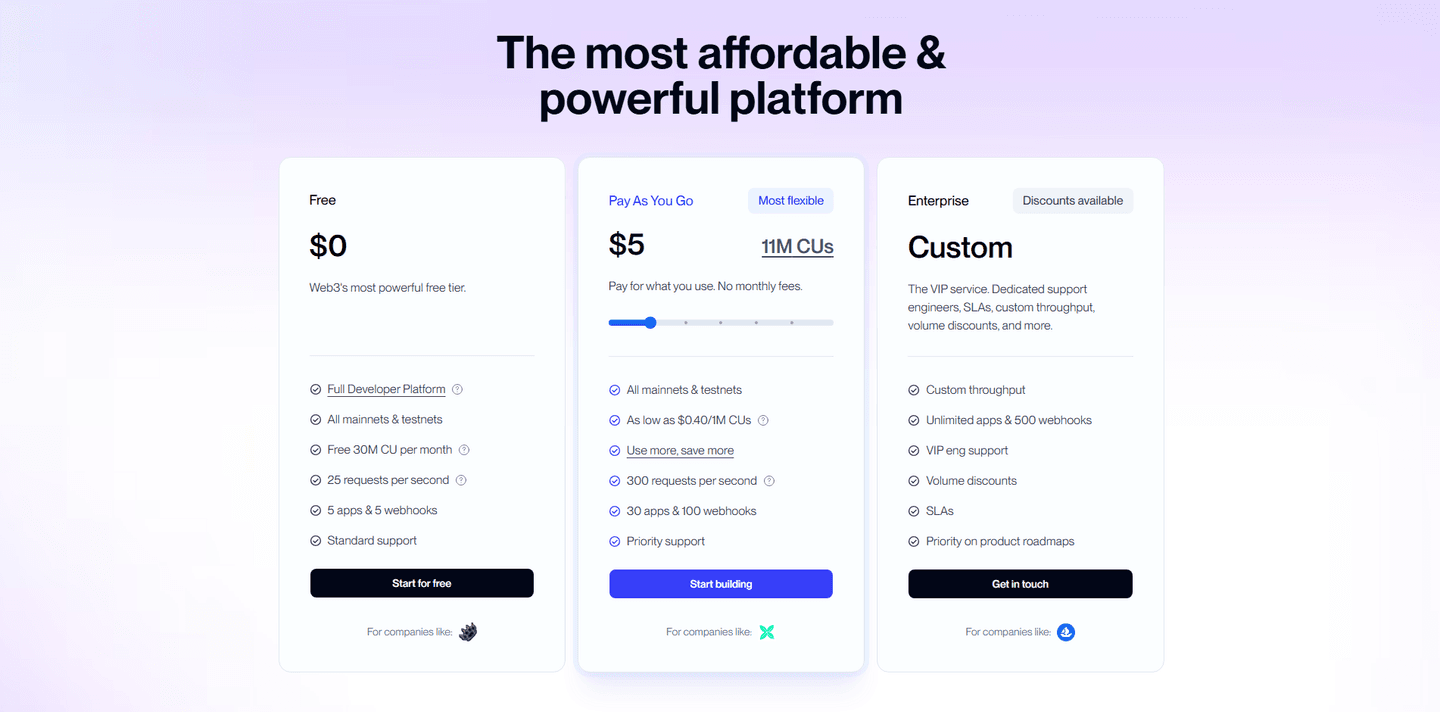
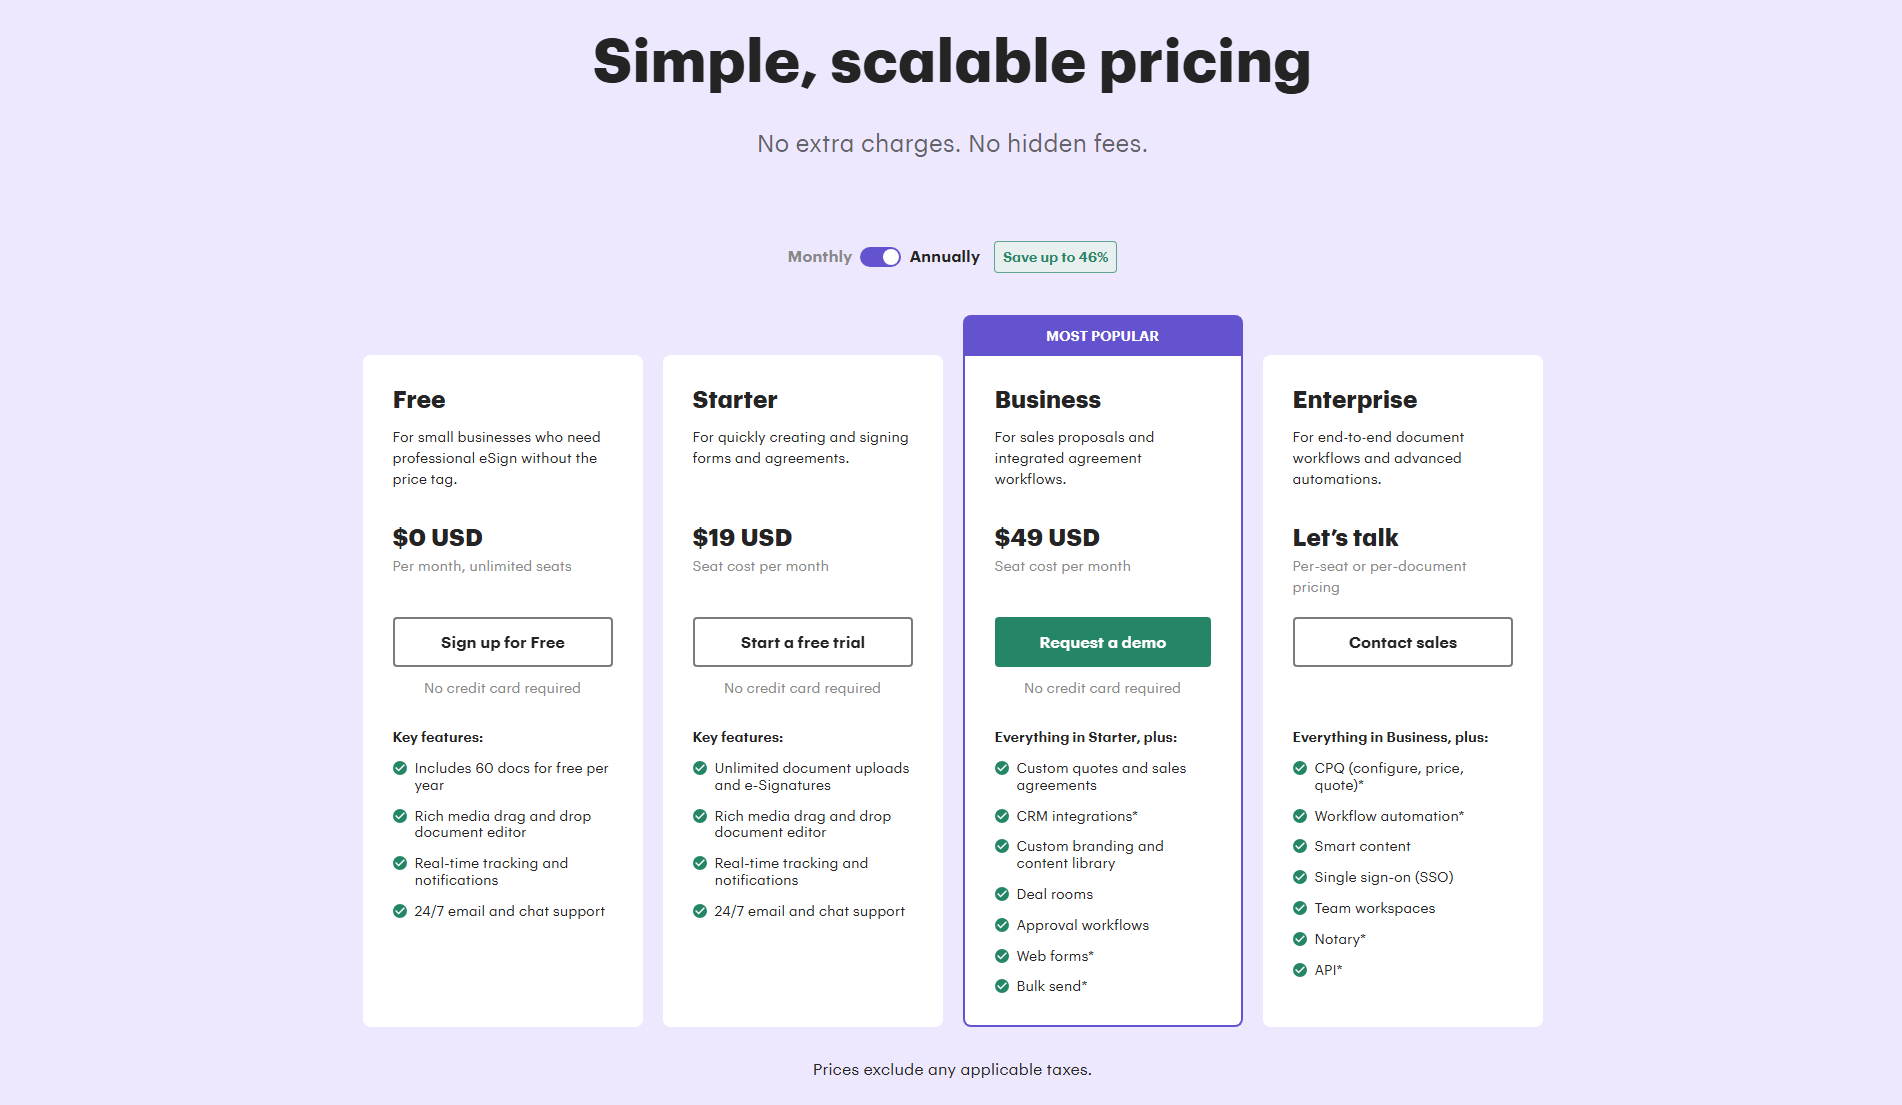
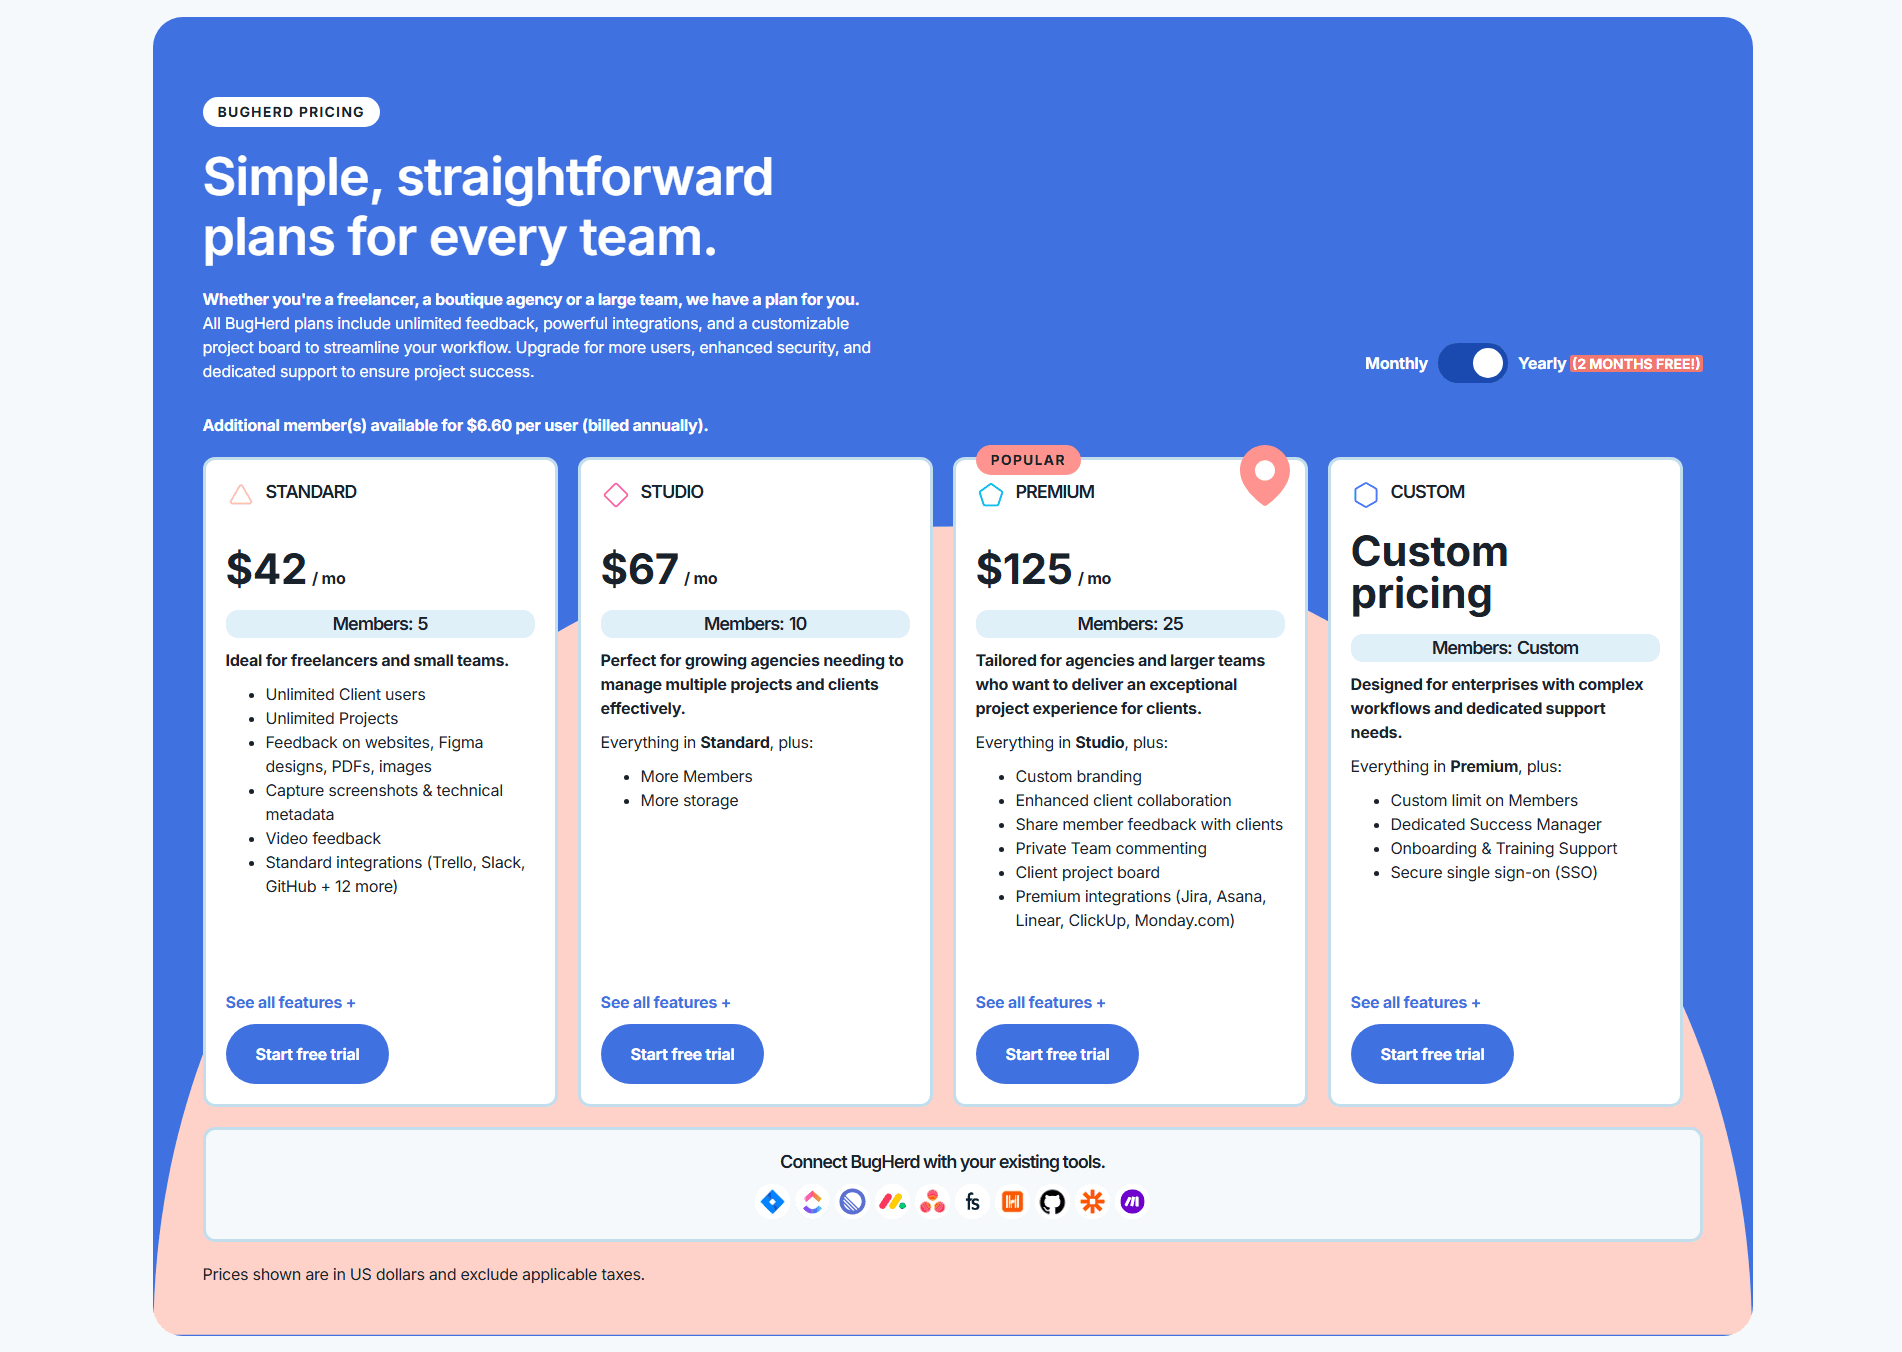
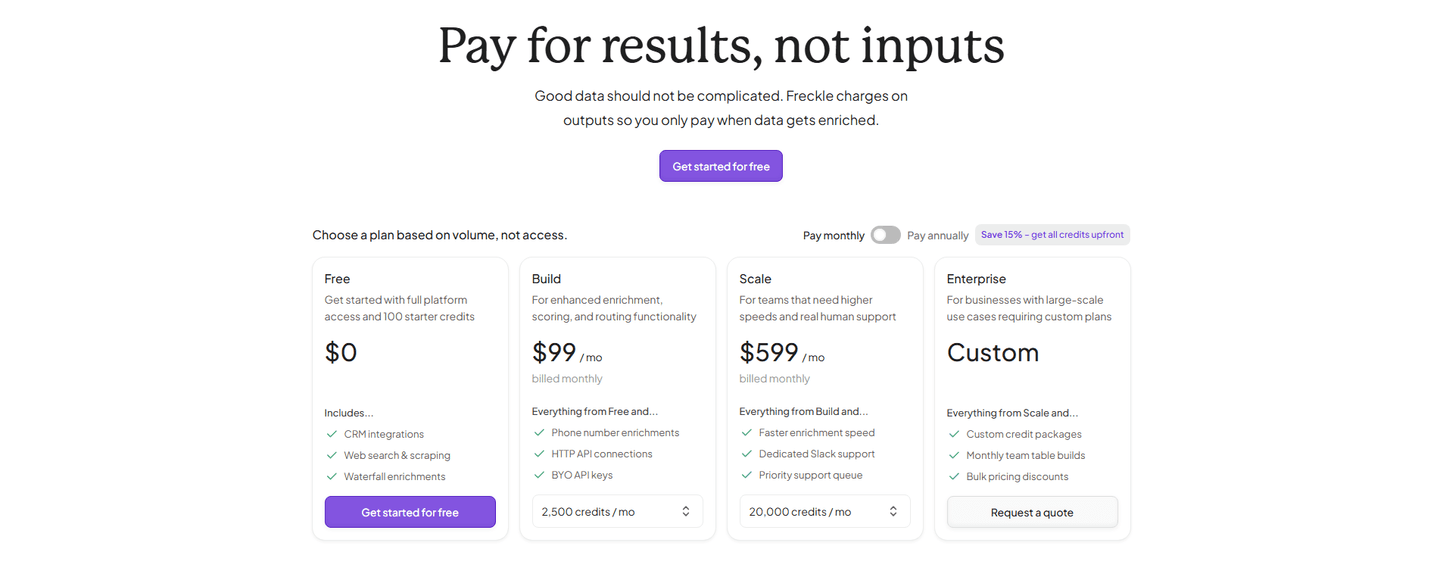
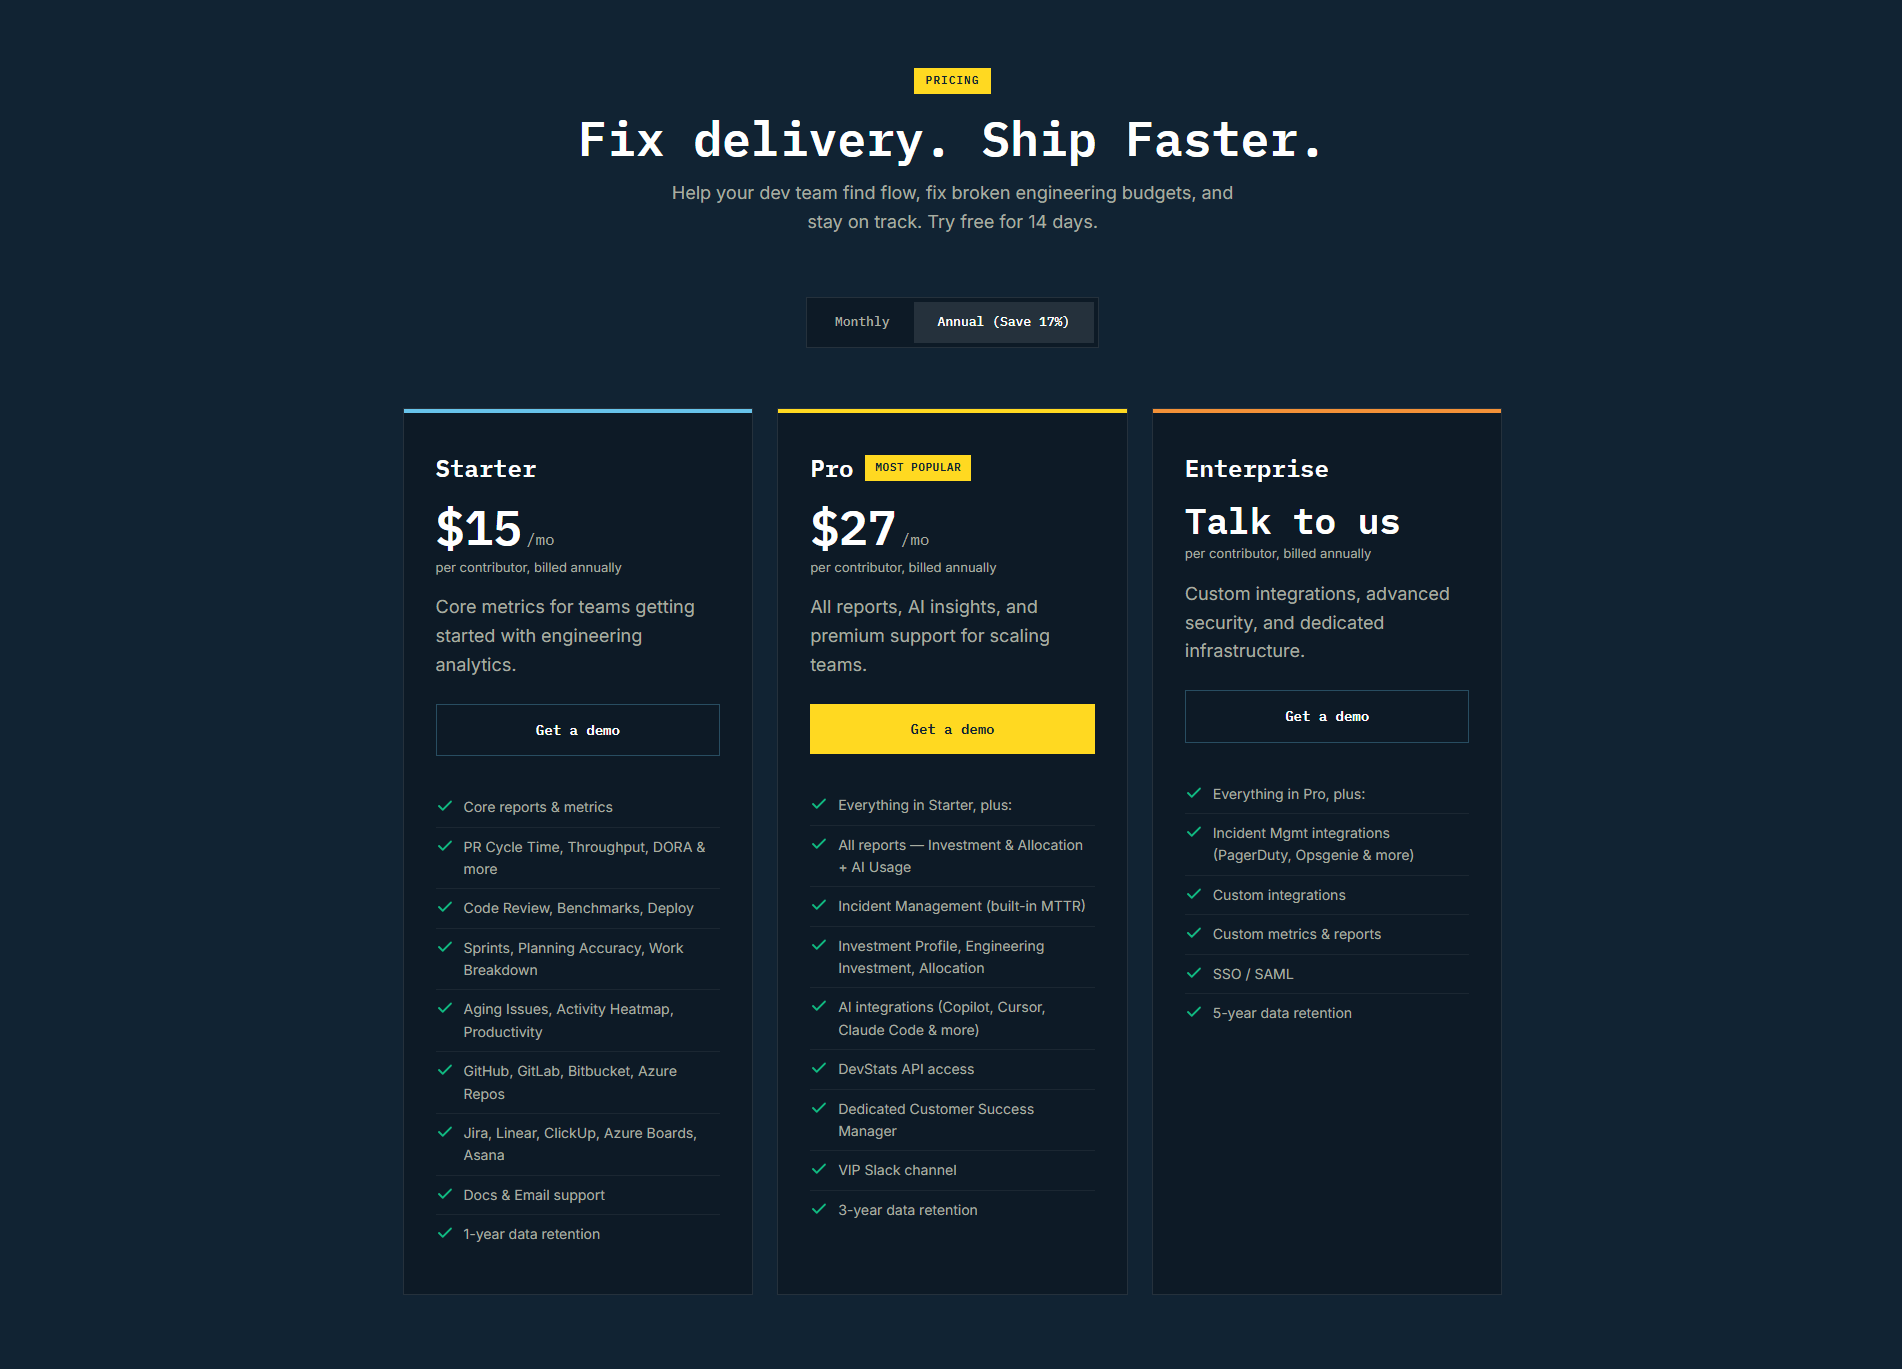
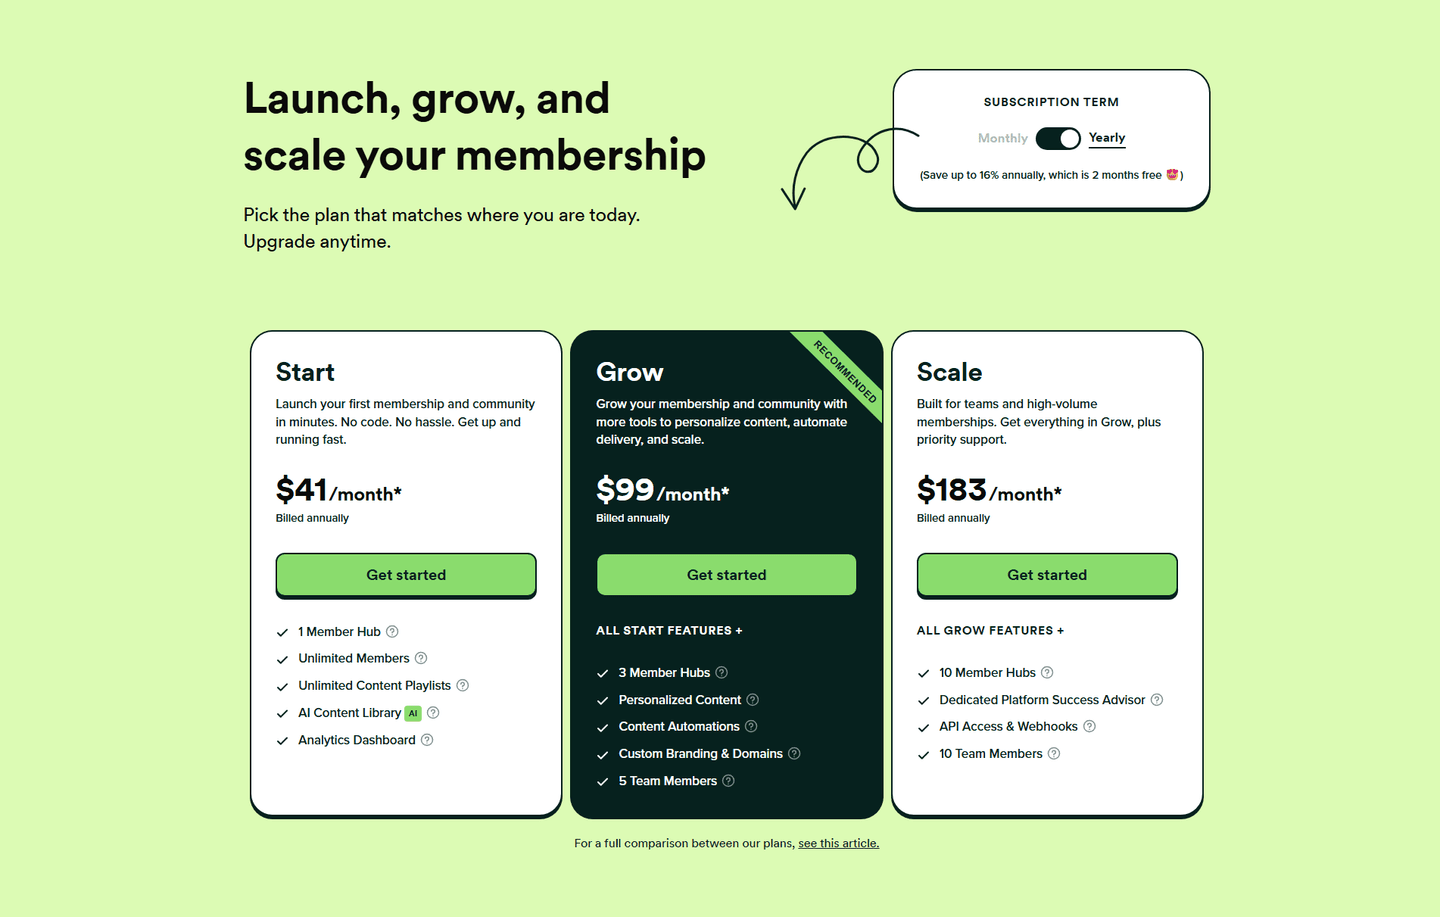
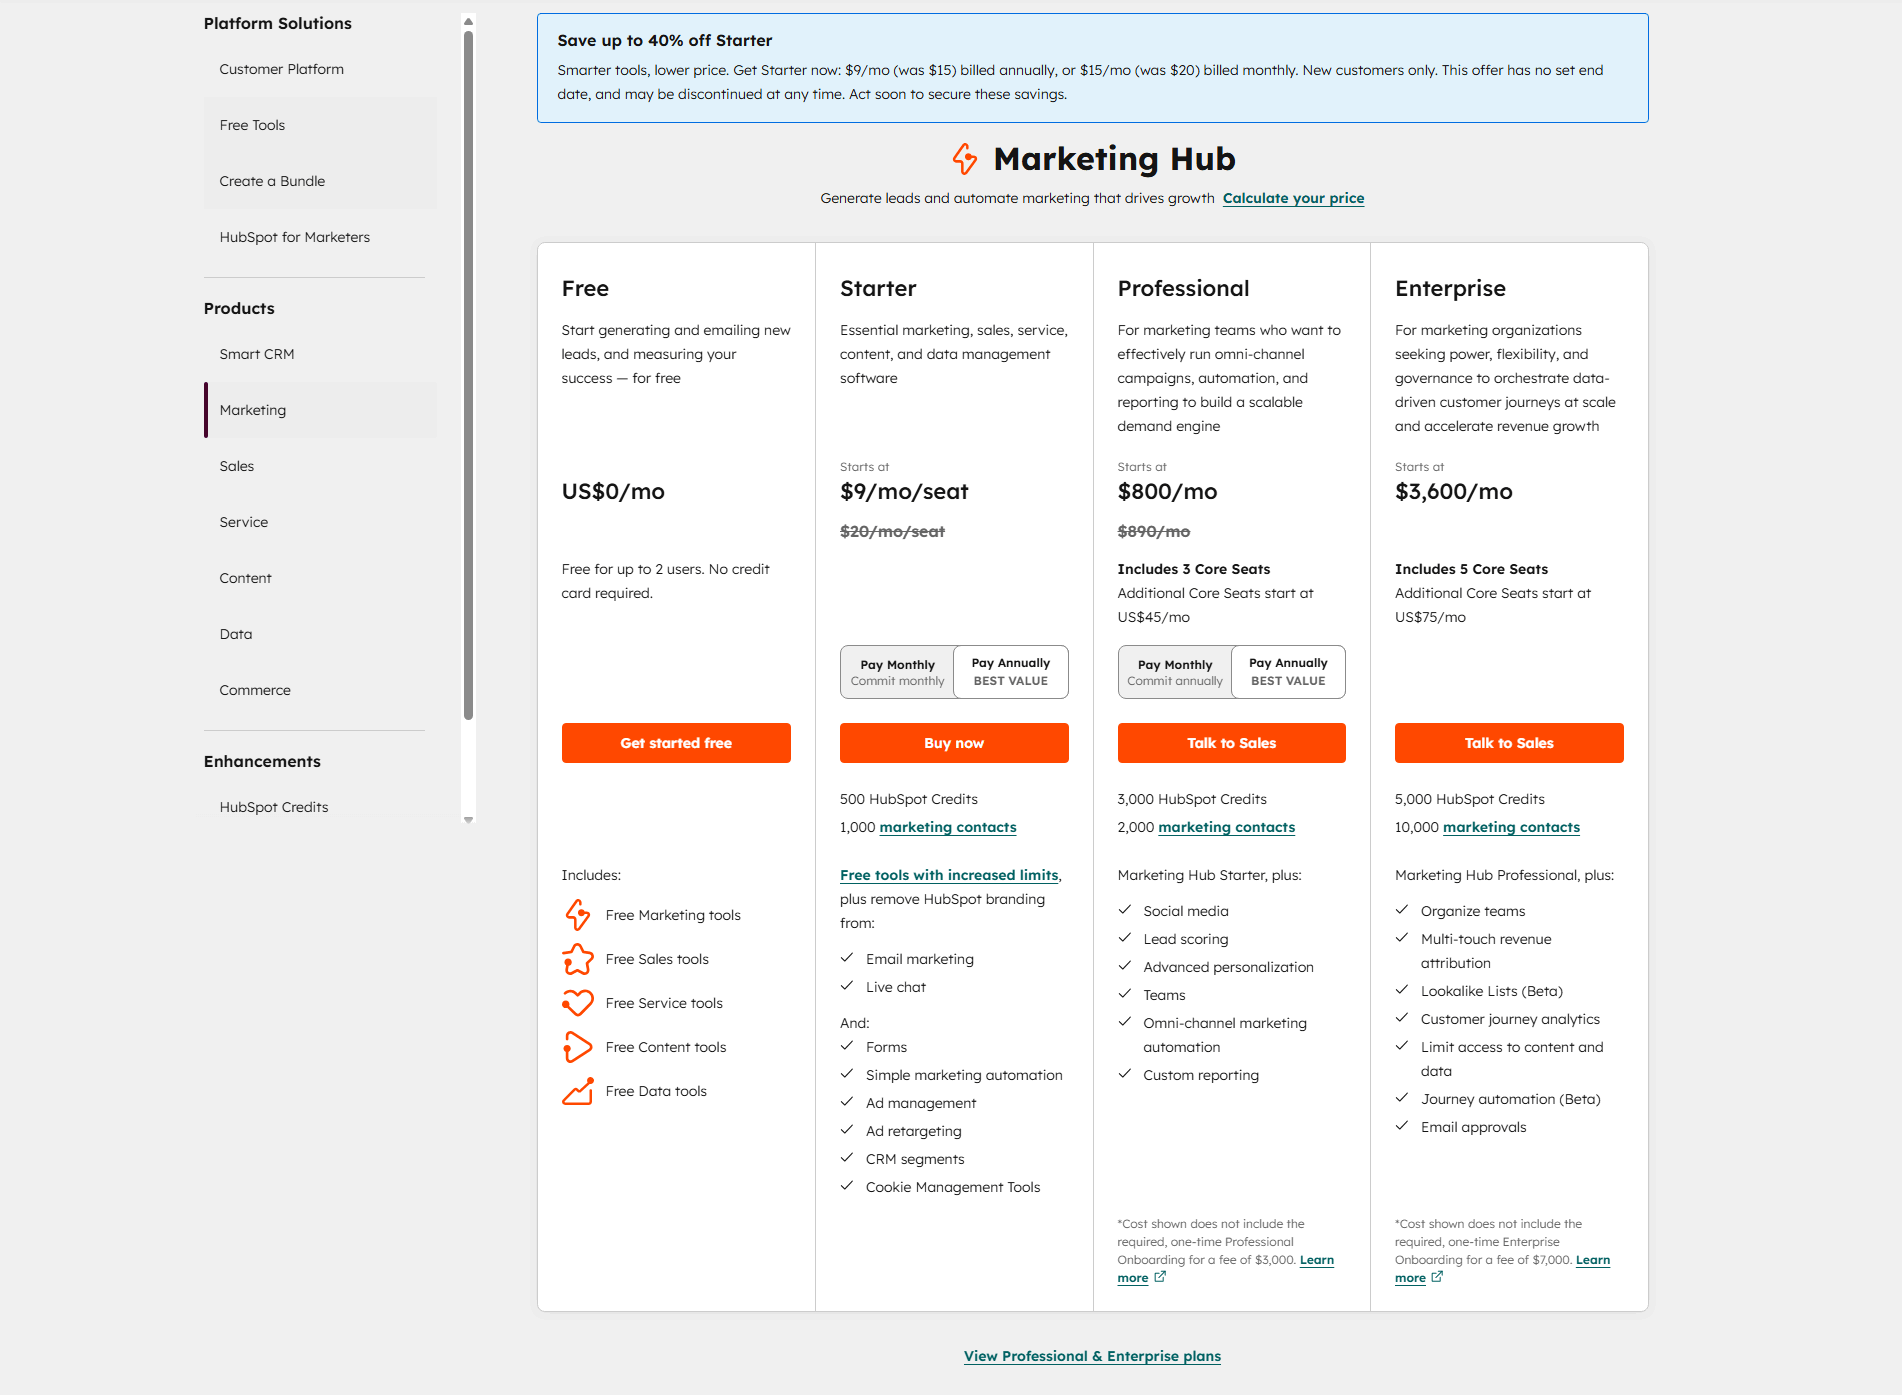
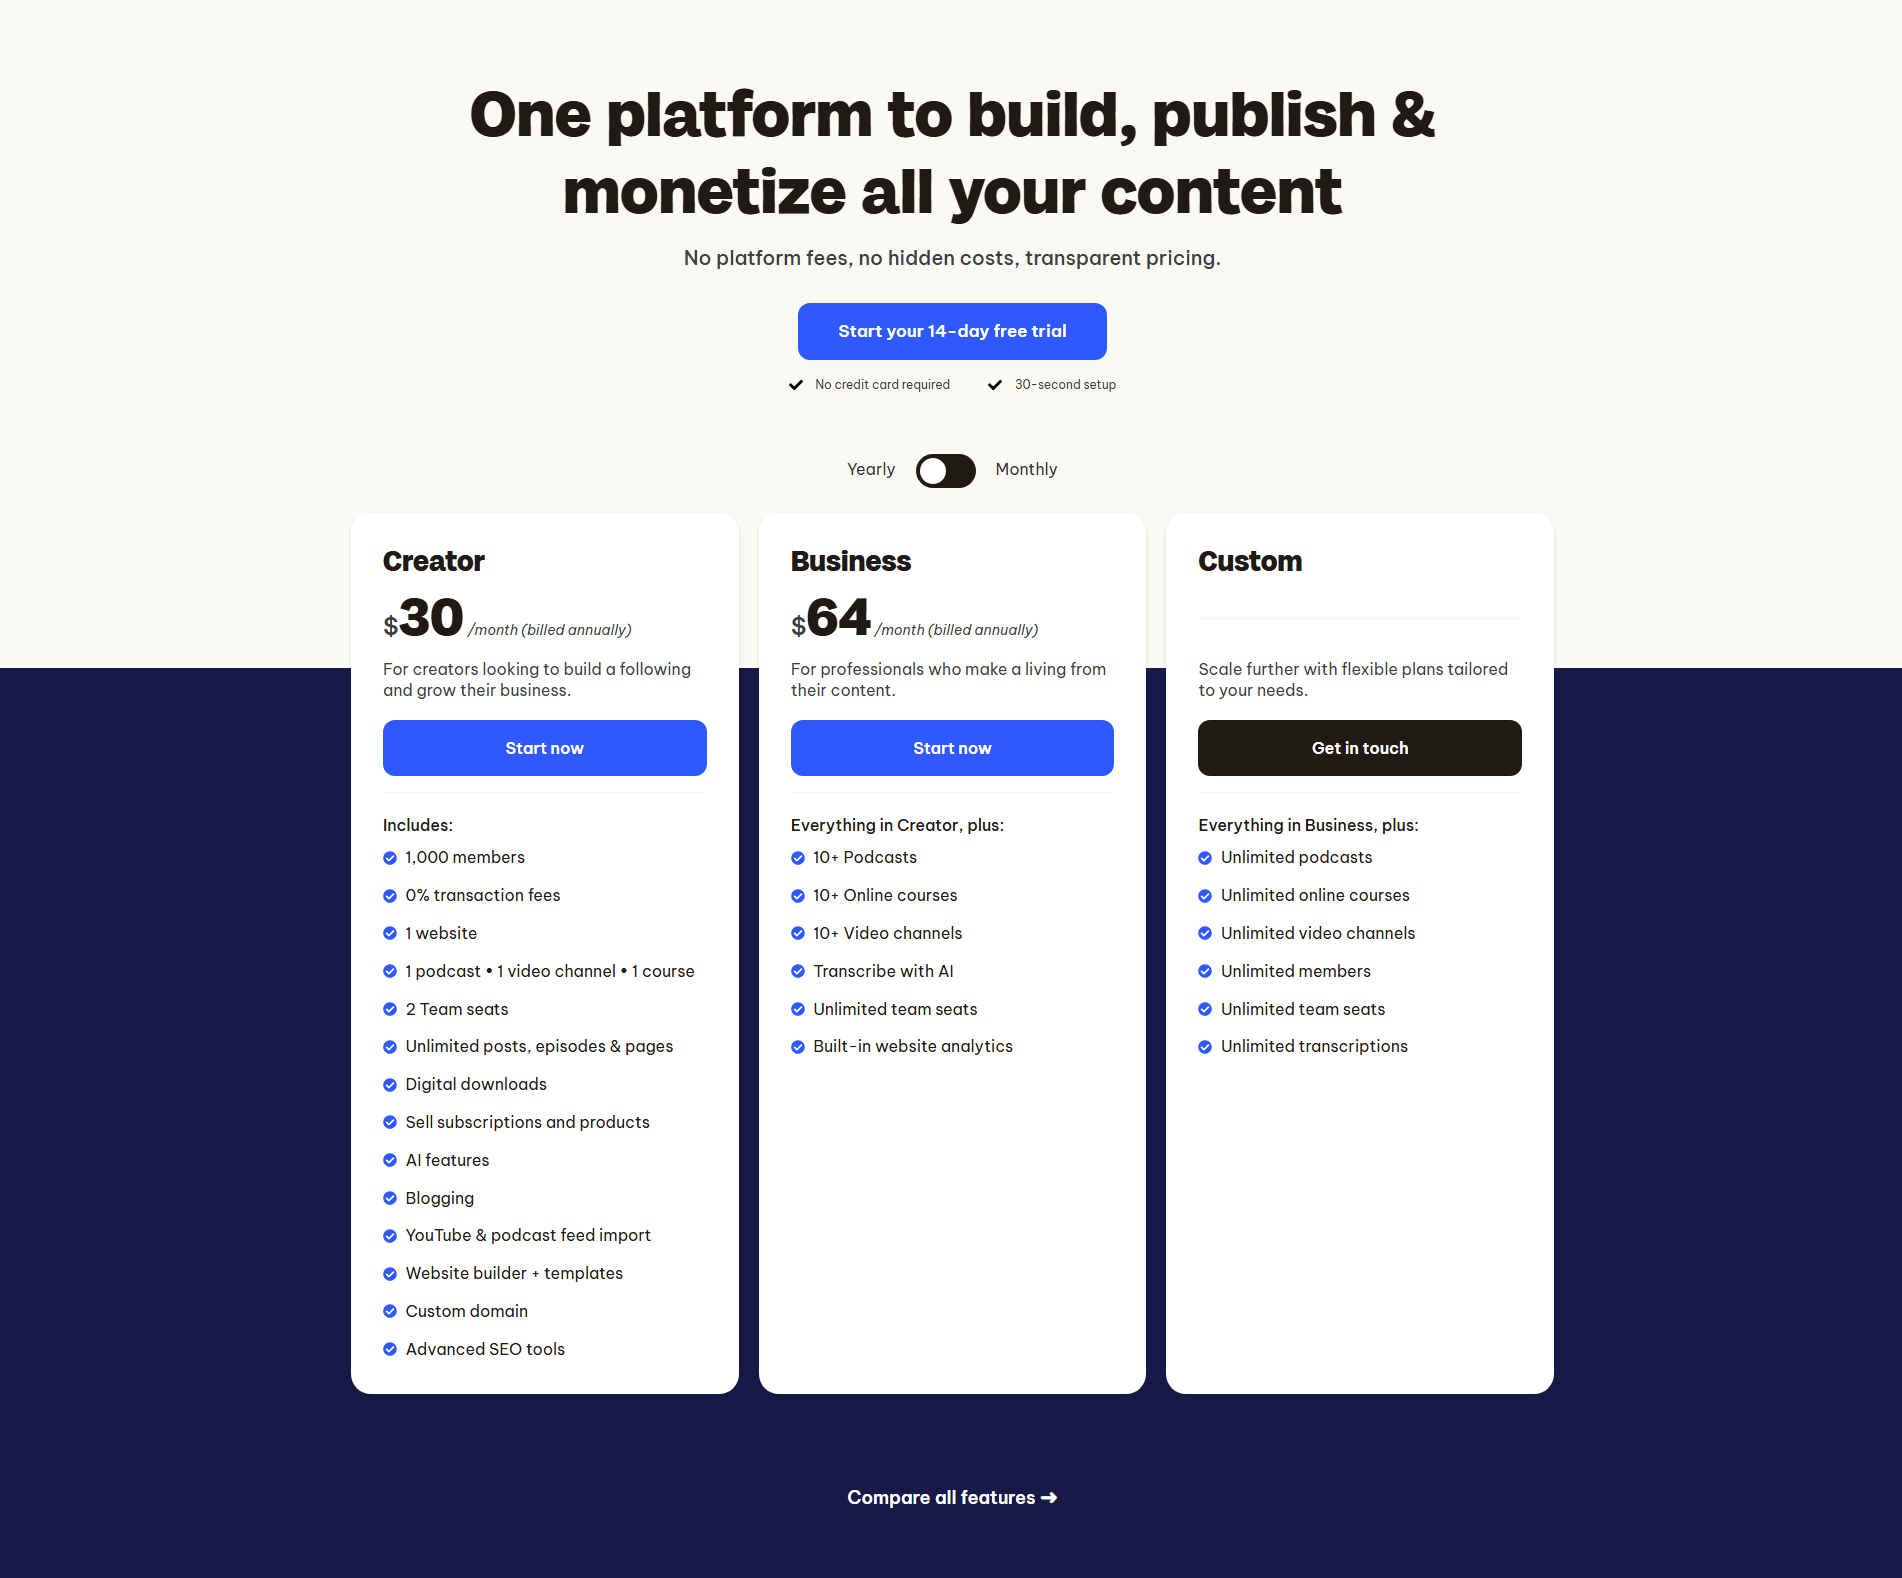
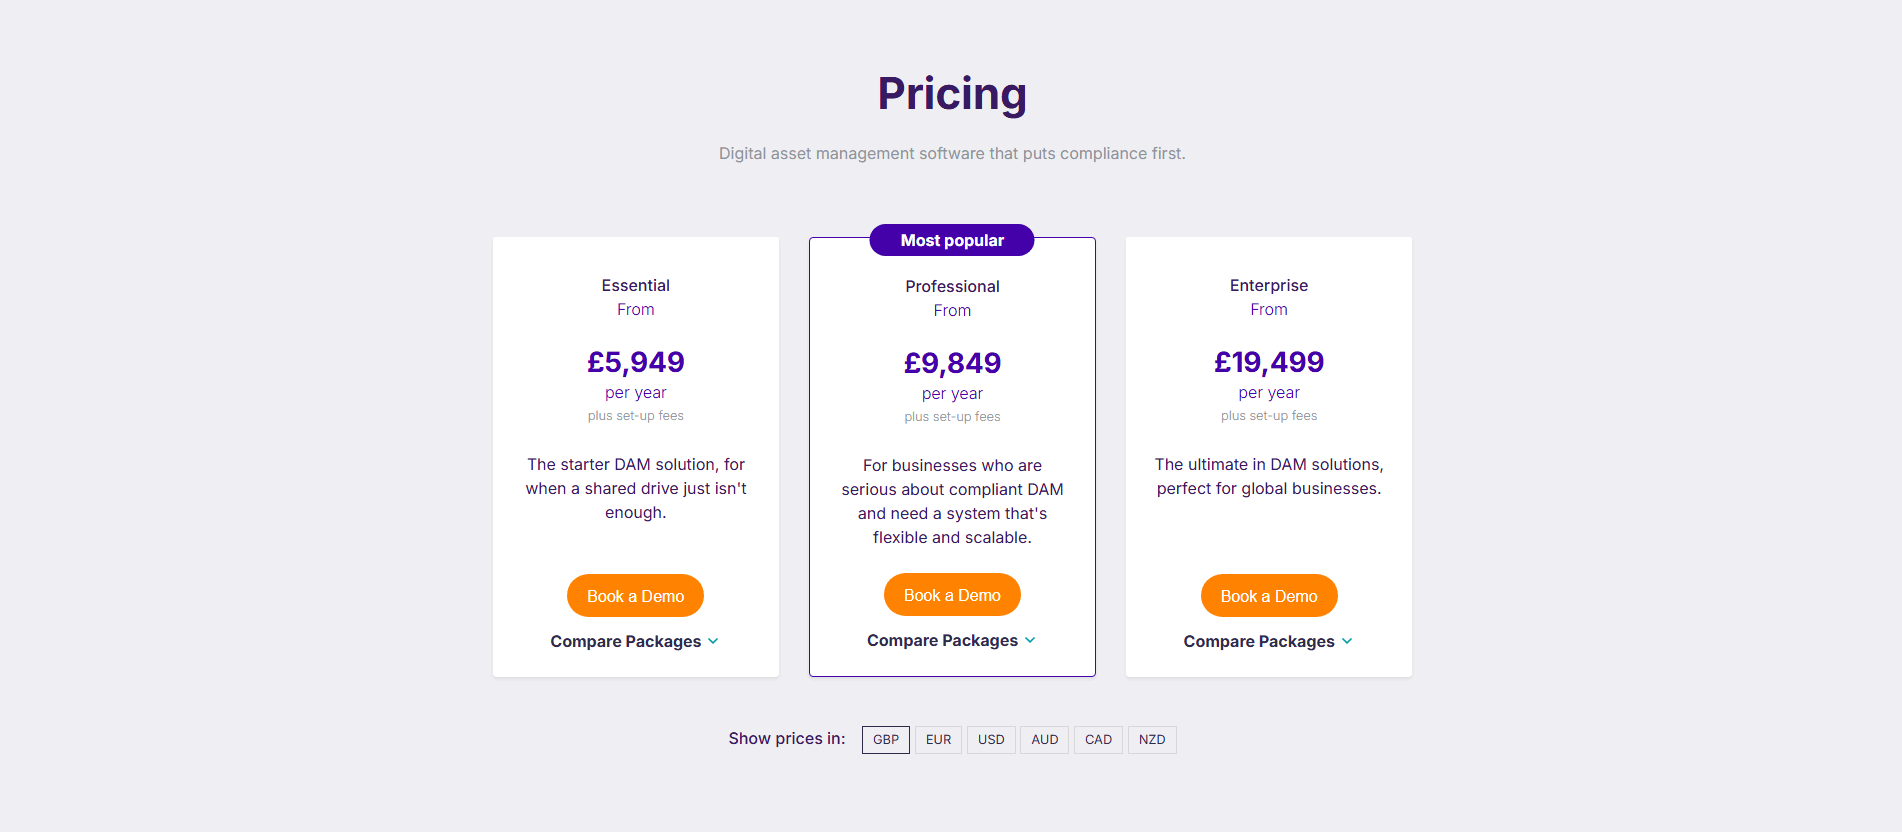
"Starter," "Growth," "Enterprise" with a one-liner under each. The visitor knows what they're buying in 5 seconds
| Element | What it means | Use it | Type |
|---|---|---|---|
| Tooltip explanations | Hover or click to expand a feature description inside the comparison table | 6% | Big opportunity |
| Calculator/estimator | For usage-based or complex pricing: a slider or input that estimates total cost | 15% | Big opportunity |
| Annual/monthly toggle | A switch showing monthly vs annual pricing with the savings displayed | 31% | Opportunity |
| Value-based naming | "Growth" not "Tier 2," "Pro" not "Plan B." Names that map to an aspiration, not an internal SKU | 56% | Common |
| Risk reducer | "14-day free trial," "Cancel anytime," "Money-back guarantee" near the CTA button | 60% | Common |
| Anchoring tags | "Most Popular," "Best Value," "Recommended." A visual nudge toward the plan you want them to pick | 73% | Common |
| Easy comparison | Side-by-side columns with a feature matrix. The visitor can scan horizontally without scrolling or opening tabs | 90% | Table stakes |
| Plan clarity | "Starter," "Growth," "Enterprise" with a one-liner under each. The visitor knows what they're buying in 5 seconds | 100% | Table stakes |
Best-in-class pricing sections are 13 percentage points more likely to use anchoring tags (86% vs 73%). That "Most Popular" badge does real work. It takes the cognitive load off the visitor and points them toward a decision.
Tooltip explanations are the rarest best practice. Only 6% of pricing sections use them. Every single one that does is flagged best-in-class in our library. When feature names are ambiguous ("Advanced analytics," "Priority support"), a tooltip turns confusion into confidence.
Across 77 scored pricing sections, here's how scores break down.
Our AI conversion agent evaluates every pricing section against a weighted checklist that spans three dimensions. Each best practice gets a pass or fail based on the actual page content and screenshot.
Not every best practice carries the same weight. Anchoring tags and risk reducers pull the score up more because in our dataset, pricing sections with those two have higher angle counts than sections without them.
Sections flagged best-in-class are hand-picked by our team from the highest-scoring sections. A high score gets you on the list. Best-in-class means the structure, copy, and psychology all work together.
Interactive quiz
Can a visitor understand all plan options in under 5 seconds?
"Starter," "Growth," "Enterprise" with a one-liner under each
35 pricing sections in our library are flagged best-in-class. They all score 67/100 with 5 conversion best practices each. No exceptions.
Every one of them starts with the same foundation: plan clarity and easy comparison. That's table stakes. What separates them is the third, fourth, and fifth layer.
MongoDB, Calendly, PayFit, ActiveCampaign all stack five best practices in a single pricing section. That's what a score of 67 looks like.
100/100The lowest-scoring pricing sections in our library aren't confusing. They just stop at the basics.
A pricing section scoring 17/100 typically has 2 conversion best practices: plan clarity and one other (a calculator or value-based naming). No comparison matrix, no anchoring tag, no risk reducer.
The most common gap: no anchoring tag. 27% of all pricing sections skip the "Most Popular" or "Recommended" label. Without it, the visitor stares at three or four columns with equal visual weight and no starting point.
Second: no risk reducer near the CTA. 40% of all pricing sections skip the "free trial" or "cancel anytime" line. The button says "Get Started" or "Subscribe" with nothing to lower the perceived risk.
Then there's the comparison layout. 10% of pricing sections don't offer side-by-side comparison at all. The visitor has to click into each plan individually to see what's included. That's friction, not design.
The fix isn't redesigning the pricing table. It's adding 2-3 elements. An anchoring badge takes 10 minutes. A "cancel anytime" line is one sentence. The gap between a score of 17 and 67 is three missing best practices.
Want to know which best practices your pricing section is missing? Try our landing page audit →
 10/100
Curated by
Gabriel Amzallag , Founder, LPA
5 years CRO + SEO at Qonto (2021–2025). After advising 15+ SaaS on their websites (Payfit, Pigment…), the same patterns kept breaking — so I decided to build the source of truth on what works on the web: the intelligence layer every tool, builder, and team uses to ship sites that perform.
See how different industries design their pricing sections.
Real examples from top SaaS landing pages, scored and analyzed.

See how top SaaS pages structure their call-to-action sections to drive clicks. Scored examples with conversion analysis.
Browse CTA examples
How top products present their features: grids, bento layouts, interactive demos. Real examples with scores.
Browse features sections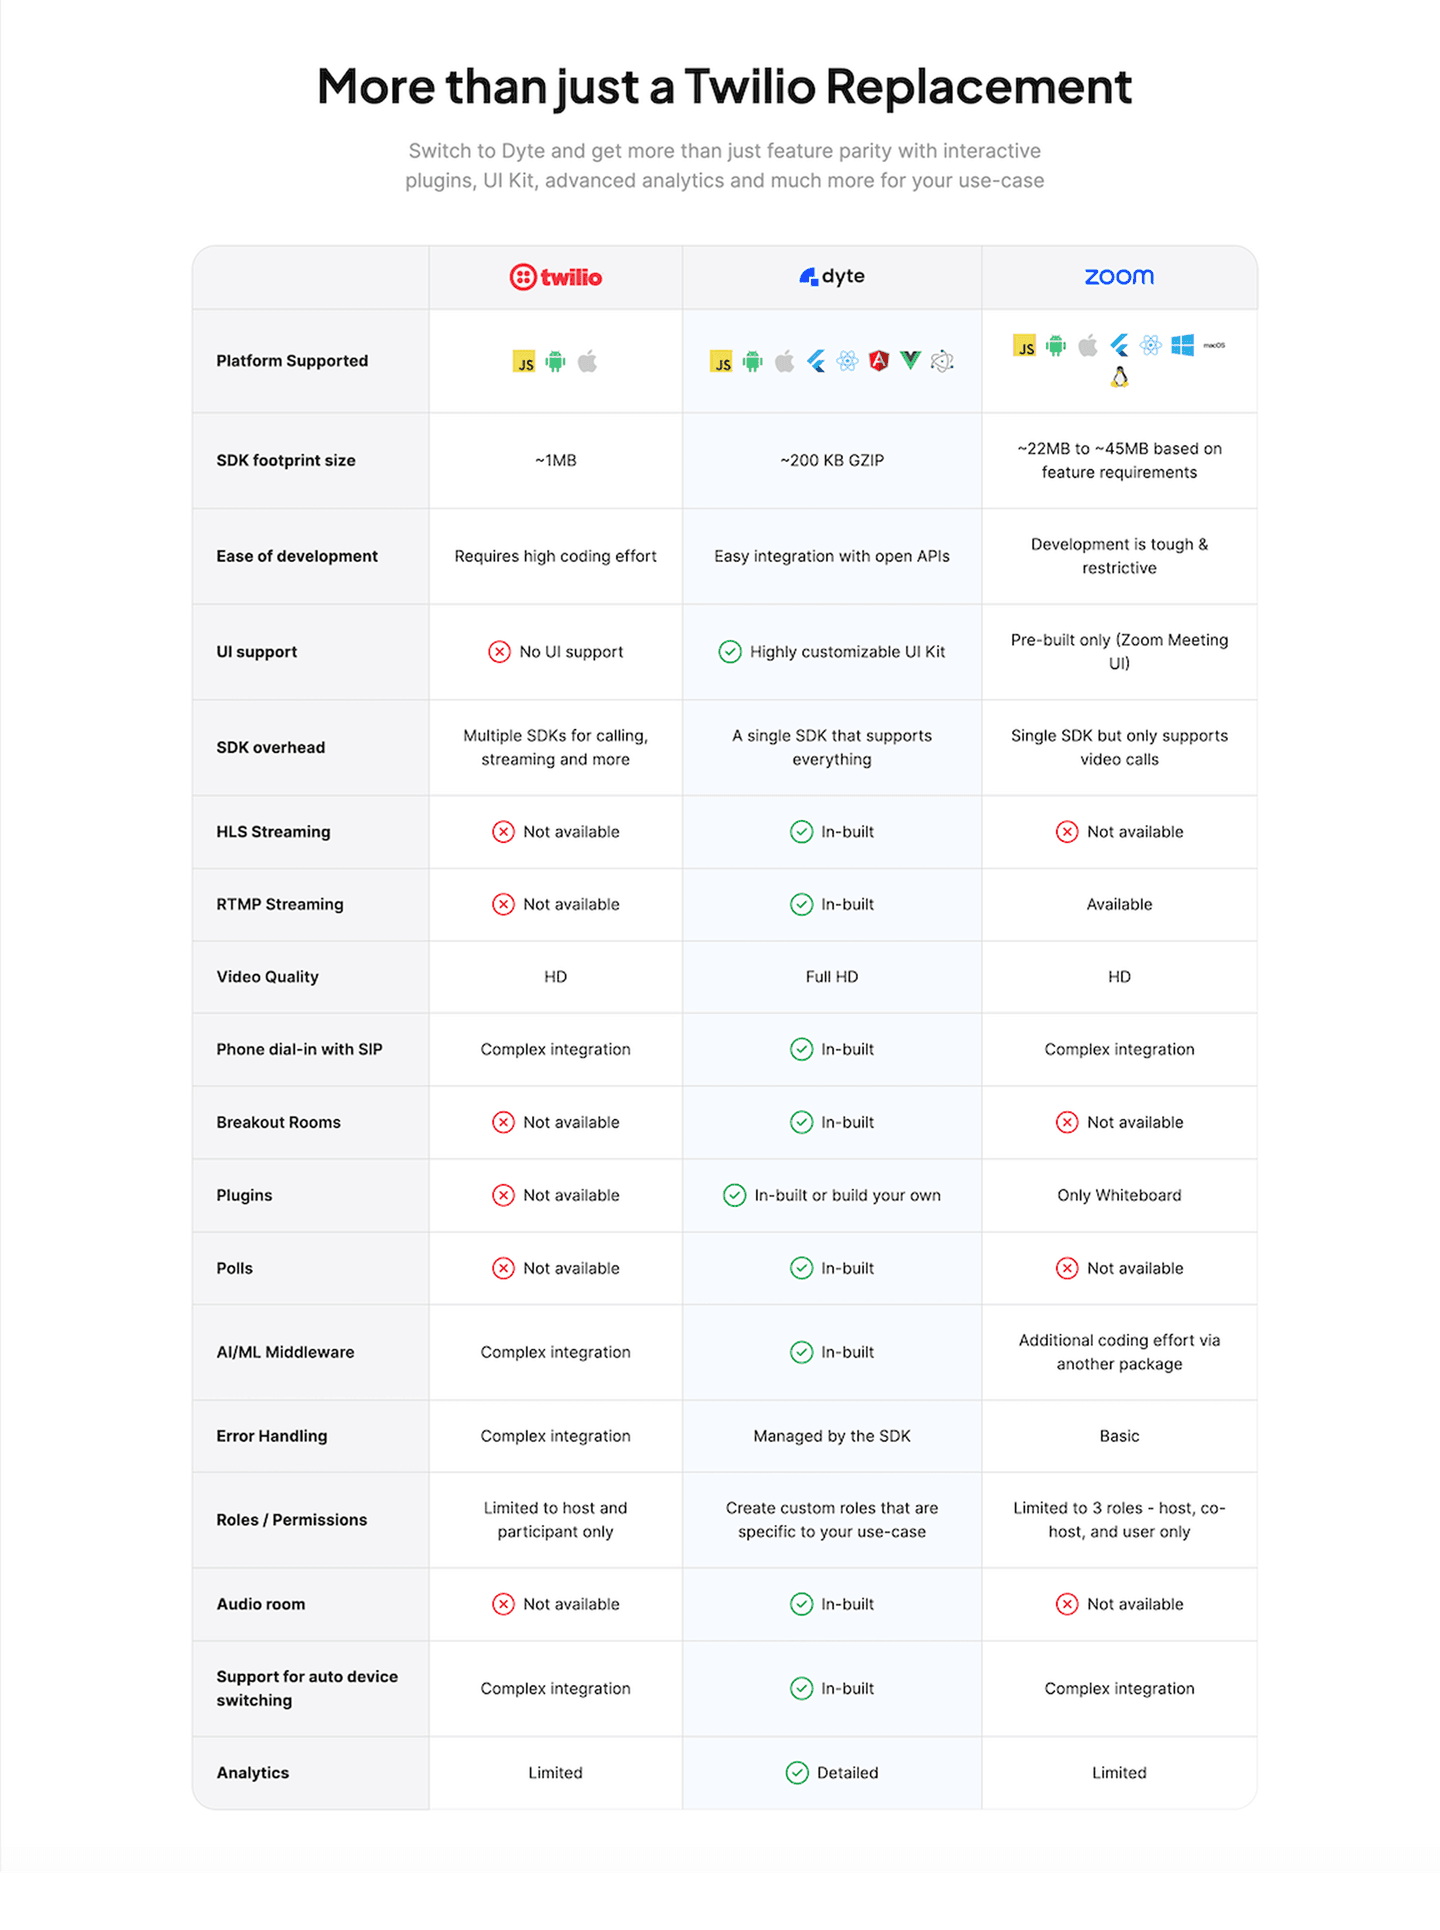
How SaaS companies position against competitors with comparison tables. Side-by-side layouts scored for clarity.
Browse comparison examplesPaste your URL. Get a scored analysis of your pricing section with specific fixes. Free, no signup.
Everything you need to know about pricing section design, based on our analysis of real SaaS landing pages.
For SMB and self-serve, show the price, the plan names, and a free trial or "no credit card" line next to every CTA. The goal is decision speed. For enterprise, pricing often stays gated, but the section should still name the tier, list the flagship capabilities, and replace "Start trial" with "Talk to sales" or "Get a custom quote." Never mix them in one column without a clear handoff. If you sell both, keep three columns for self-serve pricing and a fourth Enterprise card with "Contact us." Same layout, different CTA.
A pricing page is a standalone page (like /pricing) dedicated entirely to plans, features, and purchase decisions. A pricing section is one section within a landing page or homepage. Both use the same conversion best practices (plan clarity, comparison, anchoring tags), but a pricing page typically goes deeper with FAQs, feature matrices, and enterprise CTAs. We score both.
Yes, if your pricing is public and your page has a conversion goal. SaaS homepages, campaign landing pages, product pages with a free tier or trial. Showing pricing on the landing page removes a click from the conversion path. The exception: enterprise or custom-quote products where pricing is gated behind a "Contact Sales" form.
Map each name to a stage the buyer recognizes, not an internal SKU. "Starter, Growth, Scale" works because those are stages of a business. "For learning, For production" works because those are use cases. "Tier 1, Tier 2, Tier 3" forces the visitor to decode. A good test: read the name out loud and ask "would my target customer say that's me?" If the answer is maybe, rename. Three or four tiers max. Five starts to look like you haven't figured out your packaging.
Any time you change the packaging, and at minimum once every 12 months even if you don't. Pricing pages drift: plan features get added quietly, limits change, the old "Most Popular" badge sits on a tier nobody buys anymore. Put a calendar reminder. On each review, check three things: does the recommended tier still match where most new customers land, do the feature bullets reflect what's actually shipped, and does the annual savings math still hold. Five minutes, twice a year, prevents a pricing page that silently misrepresents the product.
Run your page through our landing page analysis. You'll get a scored breakdown of your pricing section across 8 conversion best practices (plan clarity, easy comparison, anchoring tags, risk reducer, value-based naming, toggle, calculator, tooltip explanations) with specific fixes prioritized by impact.